All the photos, charts, and other information here are free to use without restrictions.
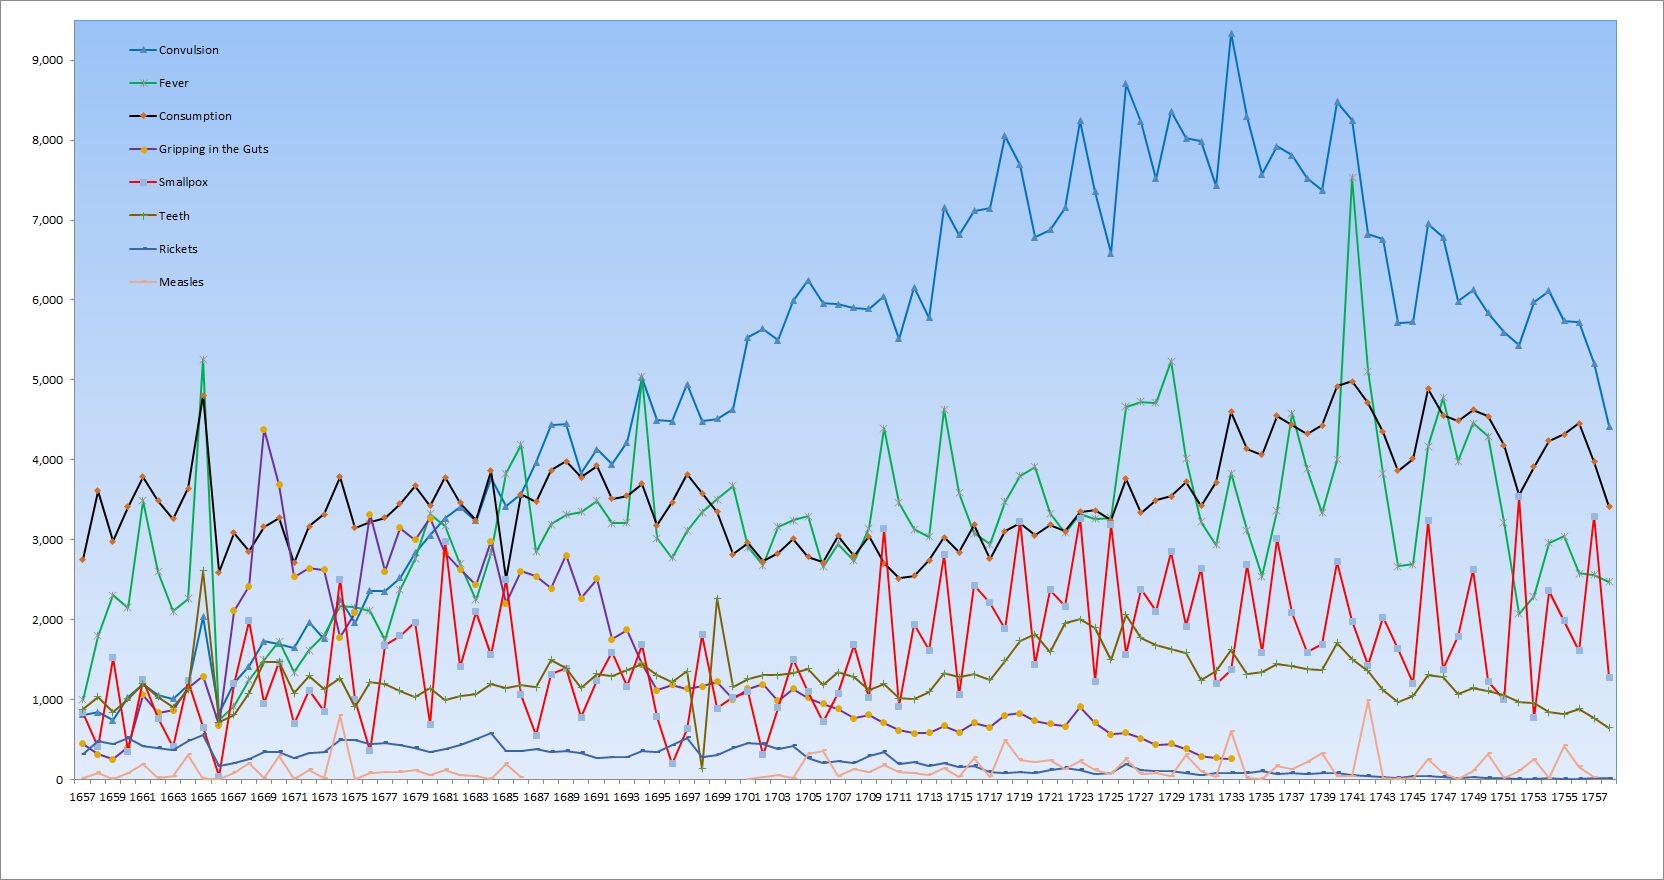
Graph 3.1: Causes of death in London 1657 to 1757. (London Bills of Mortality) *Tenth Anniversary Edition Only
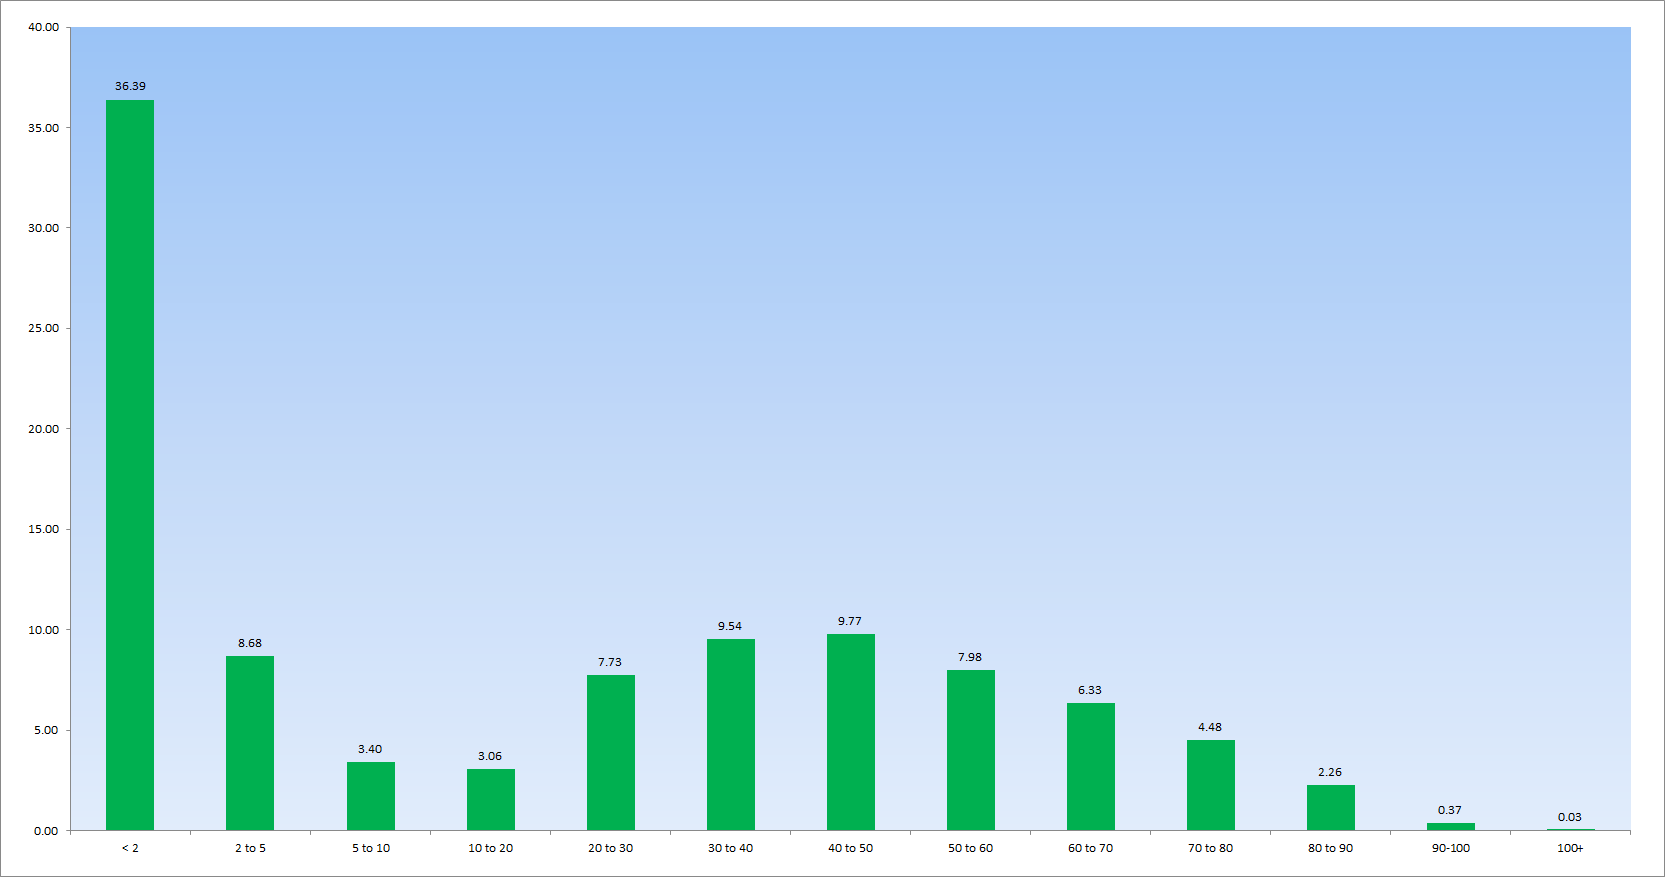
Graph 3.2: Percent Deaths Per Age Group in London 1728-1758. (London Bills of Mortality) *Tenth Anniversary Edition Only
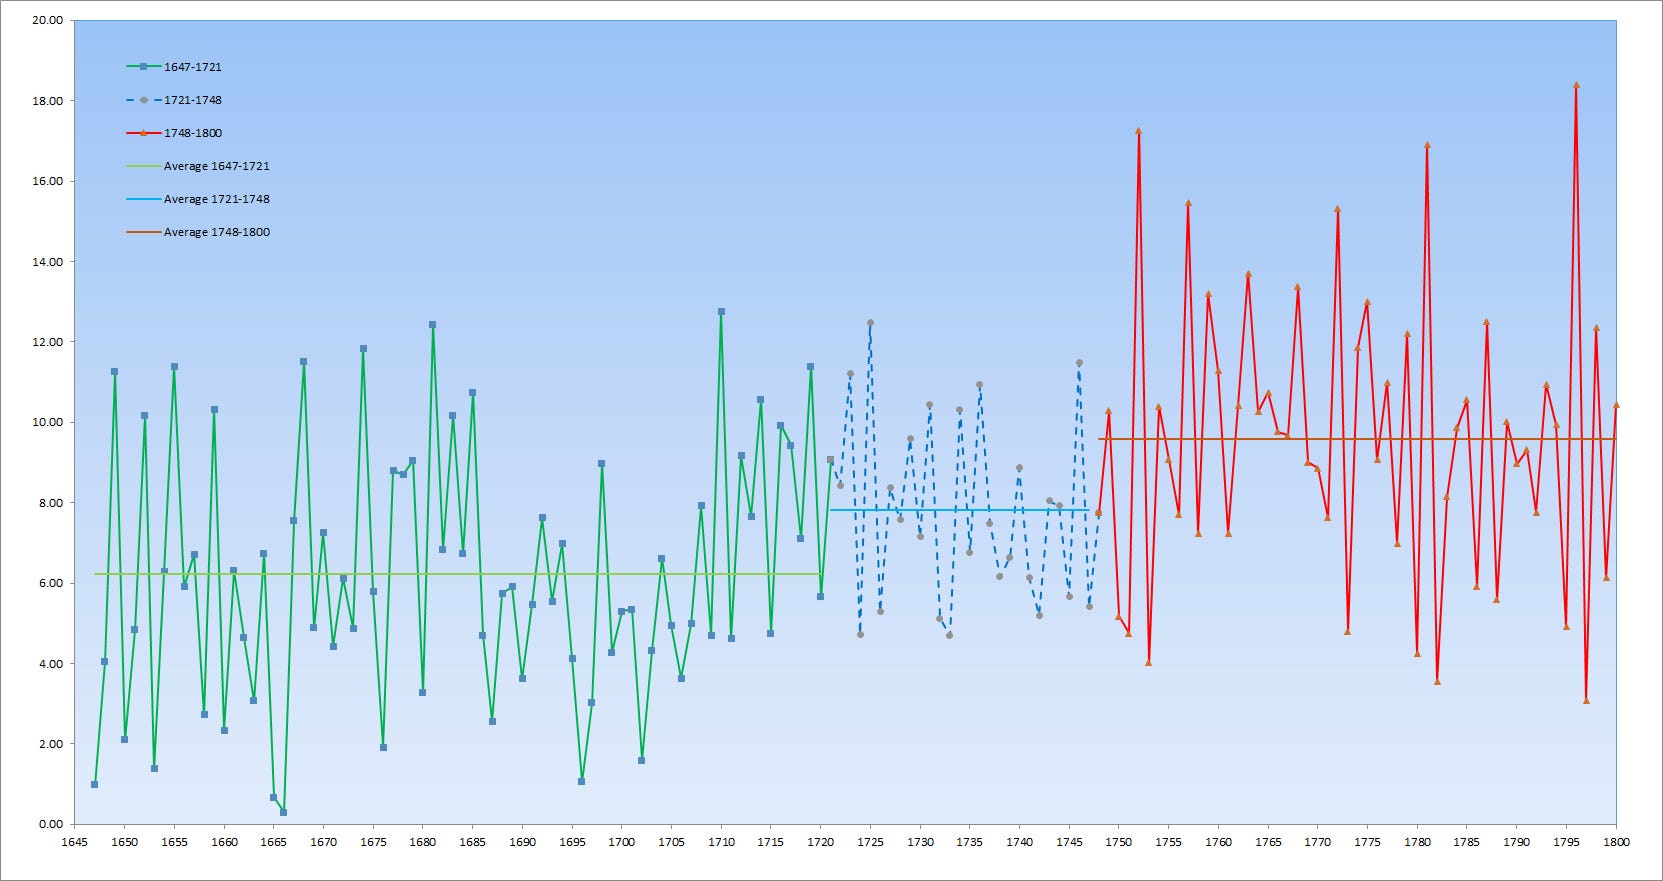
Graph 4.1: Percentage of smallpox deaths compared to total mortality in London 1645-1800. (London Bills of Mortality) *Tenth Anniversary Edition Only
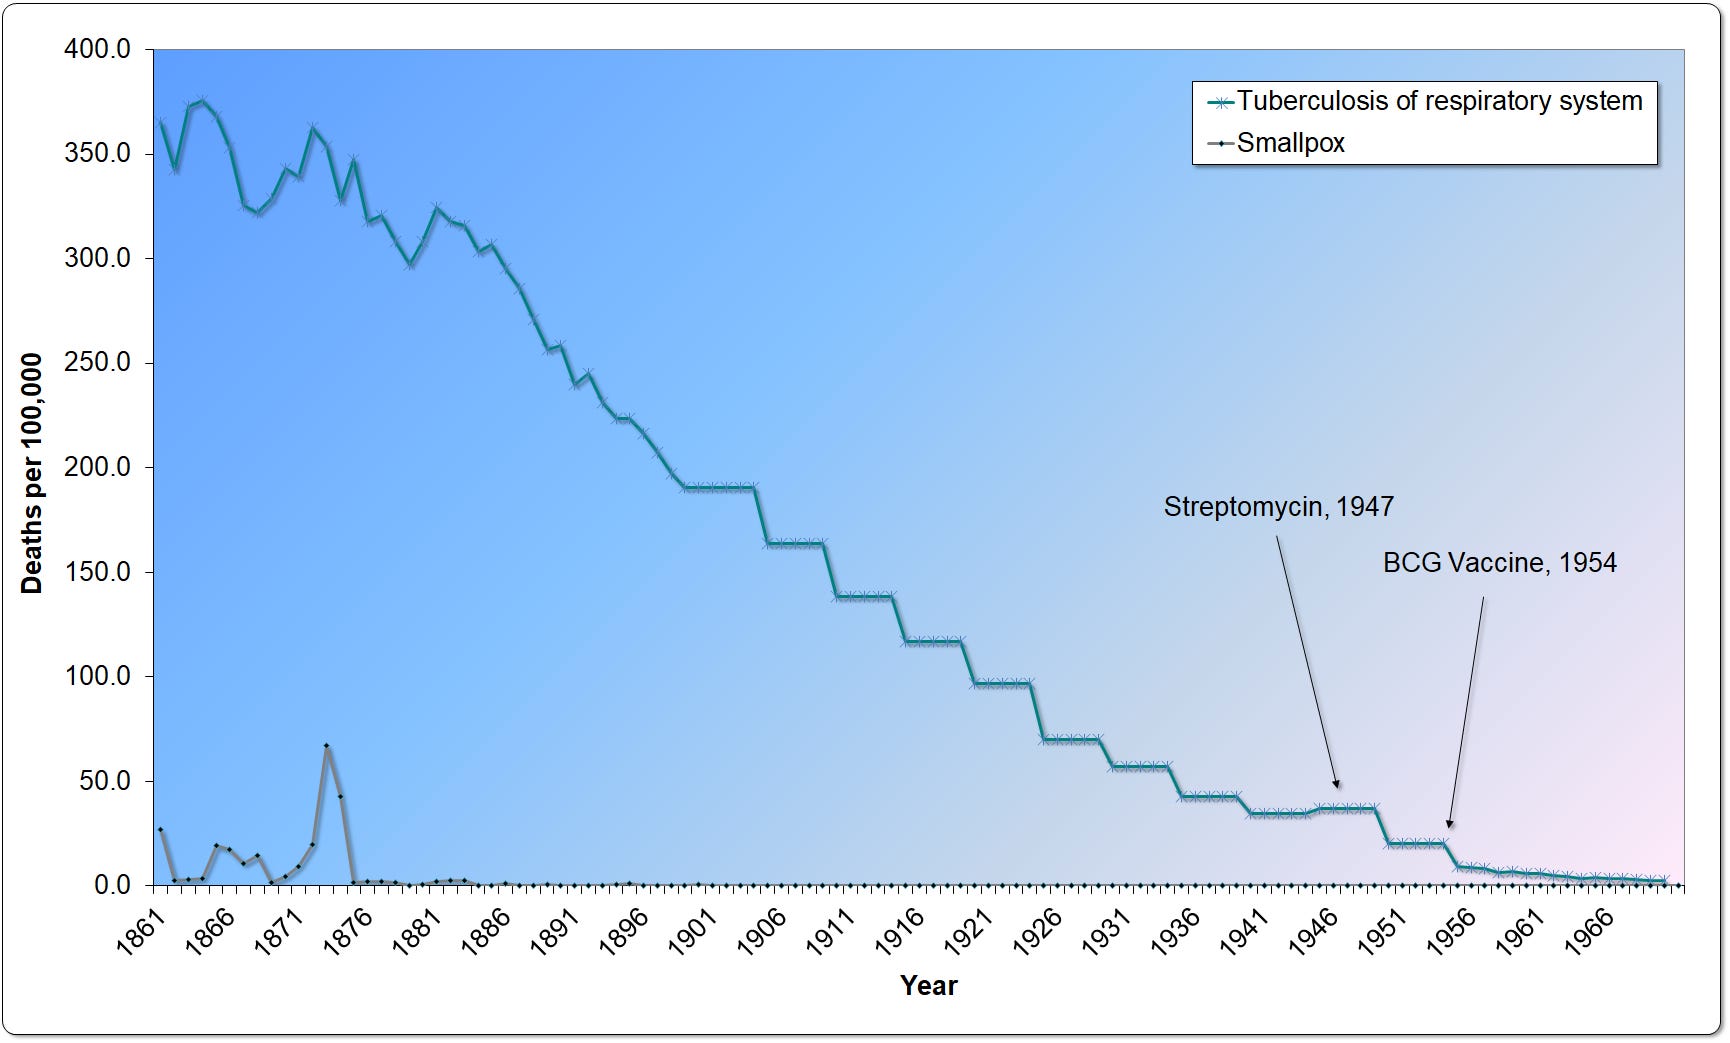
Graph 5.1: Death rates in Massachusetts from tuberculosis and smallpox from 1861 to 1970. (Historical Statistics of the United States—Colonial Times to 1970 Part 1, Bureau of the Census, p. 63) *Tenth Anniversary Edition Only
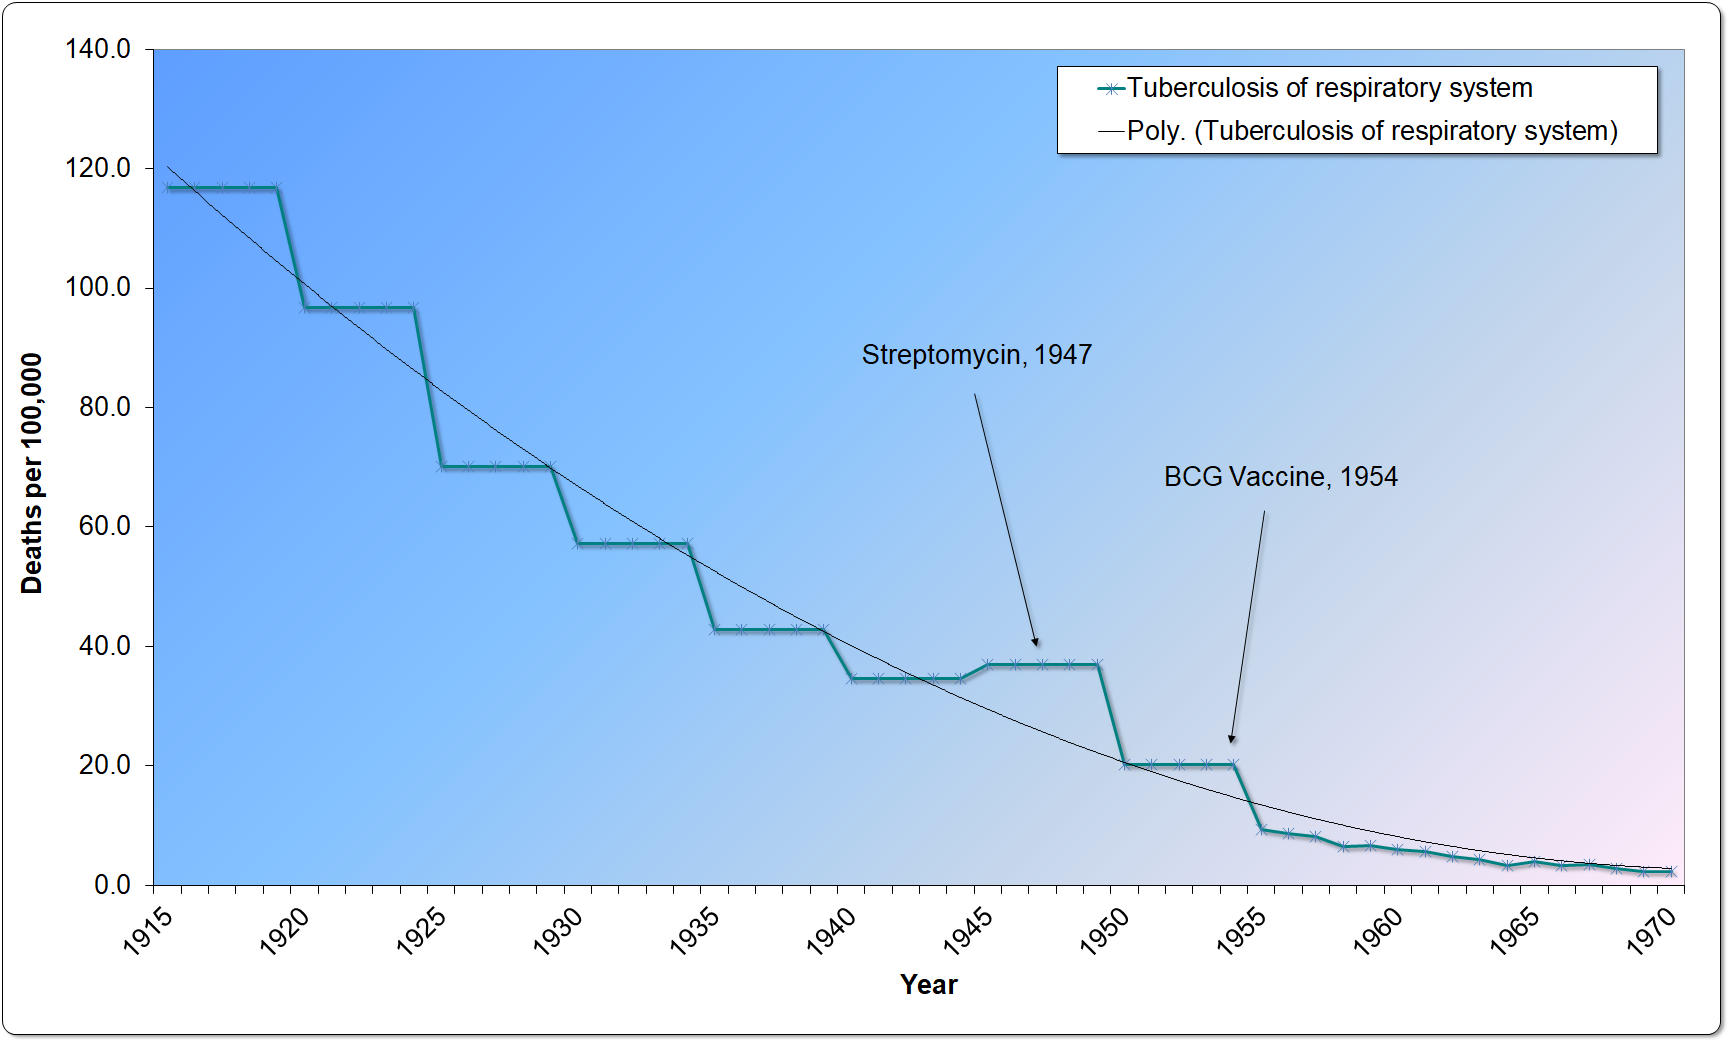
Graph 5.2: Death rates in Massachusetts from tuberculosis with trend line from 1915 to 1970. (Historical Statistics of the United States—Colonial Times to 1970 Part 1, Bureau of the Census, p. 63) *Tenth Anniversary Edition Only
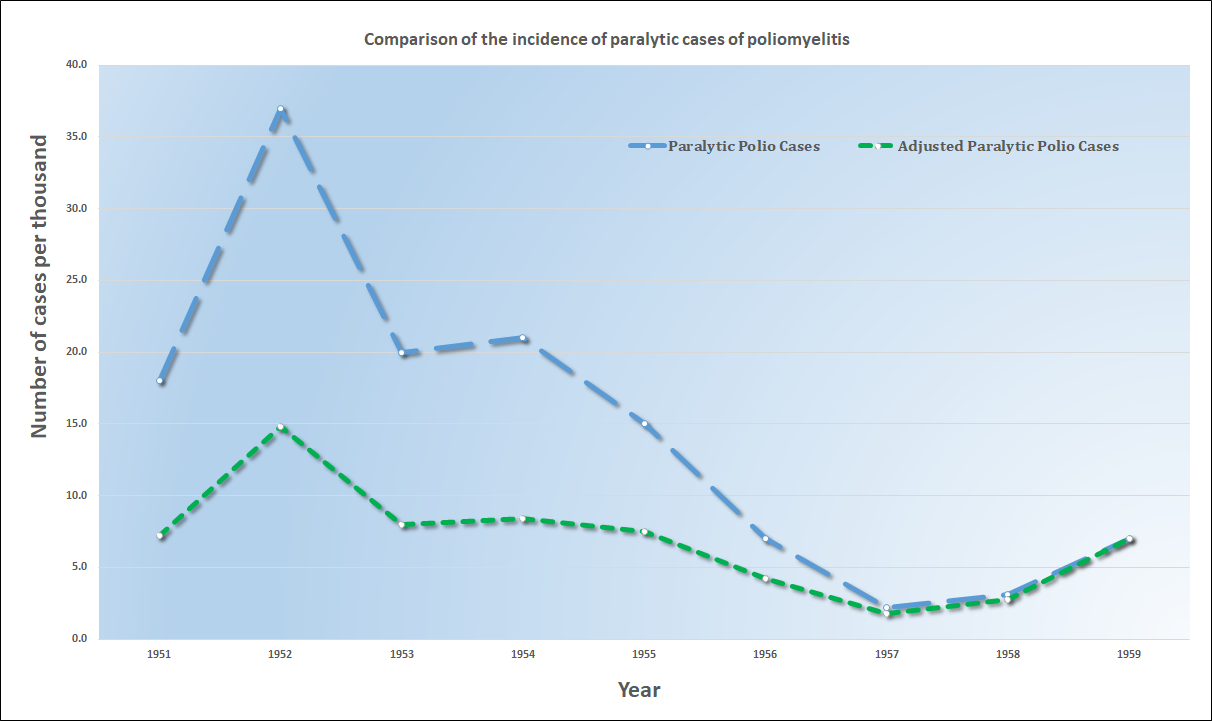
Graph 15.2: Adjusted Paralytic Cases: adjusted according to 1959 diagnostic practices to make previous years comparable to 1959; e.g., residual vs. weakness and transient paralysis; laboratory confirmation, and changing clinical and public health practices. 1951-54: reduced by 60%, 1955: reduced by 50%, 1956: reduced by 40%, 1957: reduced by 20%, 1958: reduced by 10%, 1959: reduced by 0%. (Herbert Ratner, MD, “The Present Status of Polio Vaccines,” Illinois Medical Journal, August 1960, p. 85.) *Tenth Anniversary Edition Only
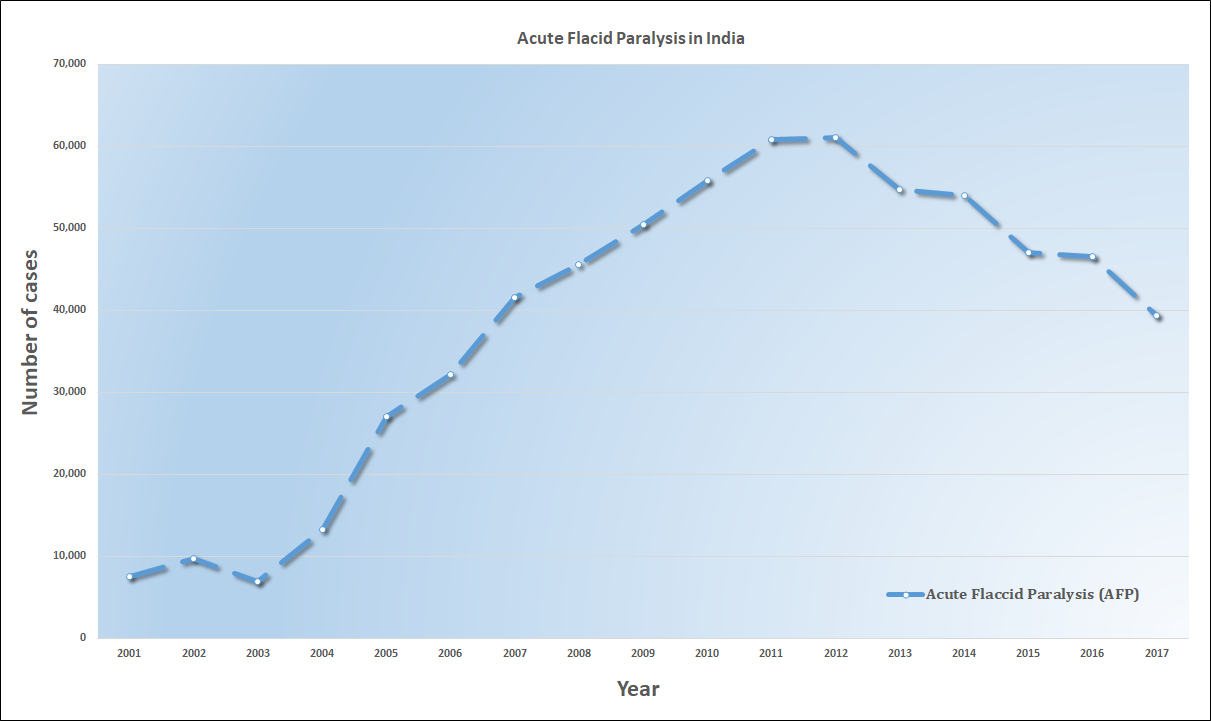
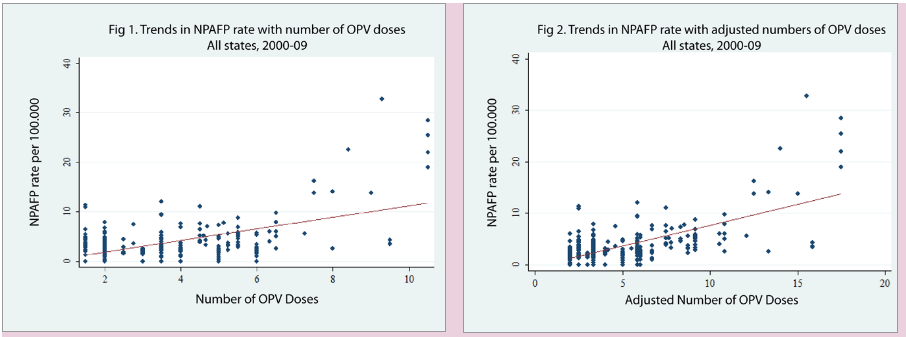
Graph 15.3: Acute flaccid paralysis (AFP) in India from 2001 to 2017. (Rachana Dhiman, Sandeep C. Prakash, V. Sreenivas, and Jacob Puliye, “Correlation between Non-Polio Acute Flaccid Paralysis Rates with Pulse Polio Frequency in India,” International Journal of Environmental Research and Public Health, August 2018, vol. 15, issue 8, pp. 1755-1762.) *Tenth Anniversary Edition Only
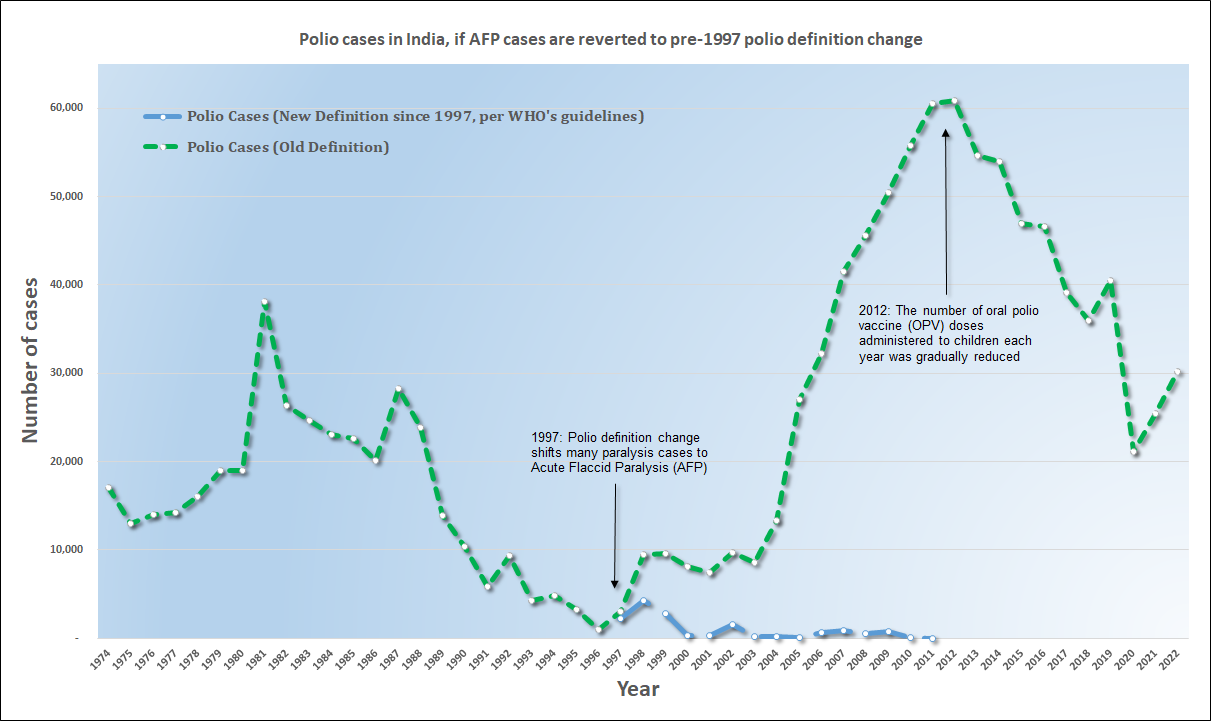
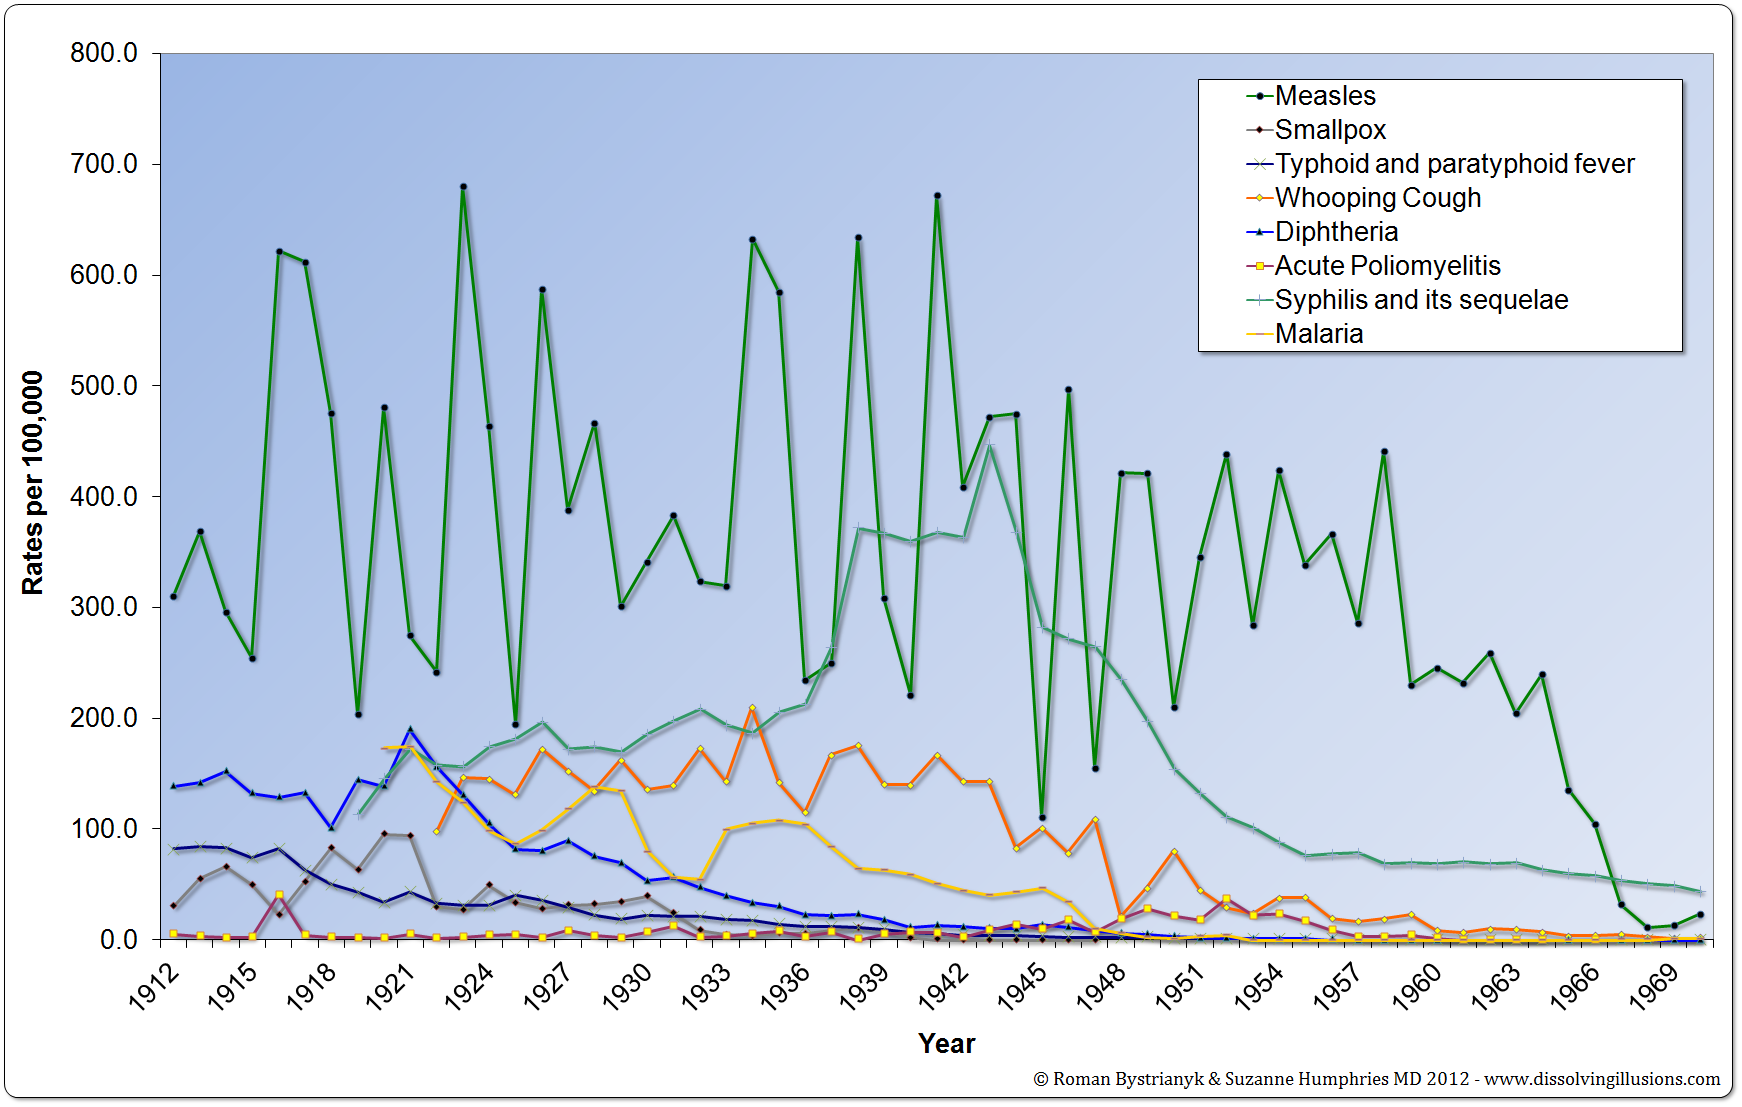
Graph 15.4: United States disease incidence from 1912 to 1970. (Historical Statistics of the United States Colonial Times to 1970 Part 1, Bureau of the Census, 1975, pp. 77) *First Edition: Graph 12.1 Graph 15.2: Adjusted Paralytic Cases: adjusted according to 1959 diagnostic practices to make previous years comparable to 1959; e.g., residual vs. weakness and transient paralysis; laboratory confirmation, and changing clinical and public health practices. 1951-54: reduced by 60%, 1955: reduced by 50%, 1956: reduced by 40%, 1957: reduced by 20%, 1958: reduced by 10%, 1959: reduced by 0%. (Herbert Ratner, MD, “The Present Status of Polio Vaccines,” Illinois Medical Journal, August 1960, p. 85.) *Tenth Anniversary Edition Only Graph 15.3: Acute flaccid paralysis (AFP) in India from 2001 to 2017. (Rachana Dhiman, Sandeep C. Prakash, V. Sreenivas, and Jacob Puliye, “Correlation between Non-Polio Acute Flaccid Paralysis Rates with Pulse Polio Frequency in India,” International Journal of Environmental Research and Public Health, August 2018, vol. 15, issue 8, pp. 1755-1762.) *Tenth Anniversary Edition Only Graph 15.4: Polio cases in India, if AFP cases are reverted to pre-1997 polio definition change from 1974 to 2022. (Underlying research by Vratesh Srivastava, Independent Data Analyst; World Health Organization (WHO) AFP/polio data. *Tenth Anniversary Edition Only
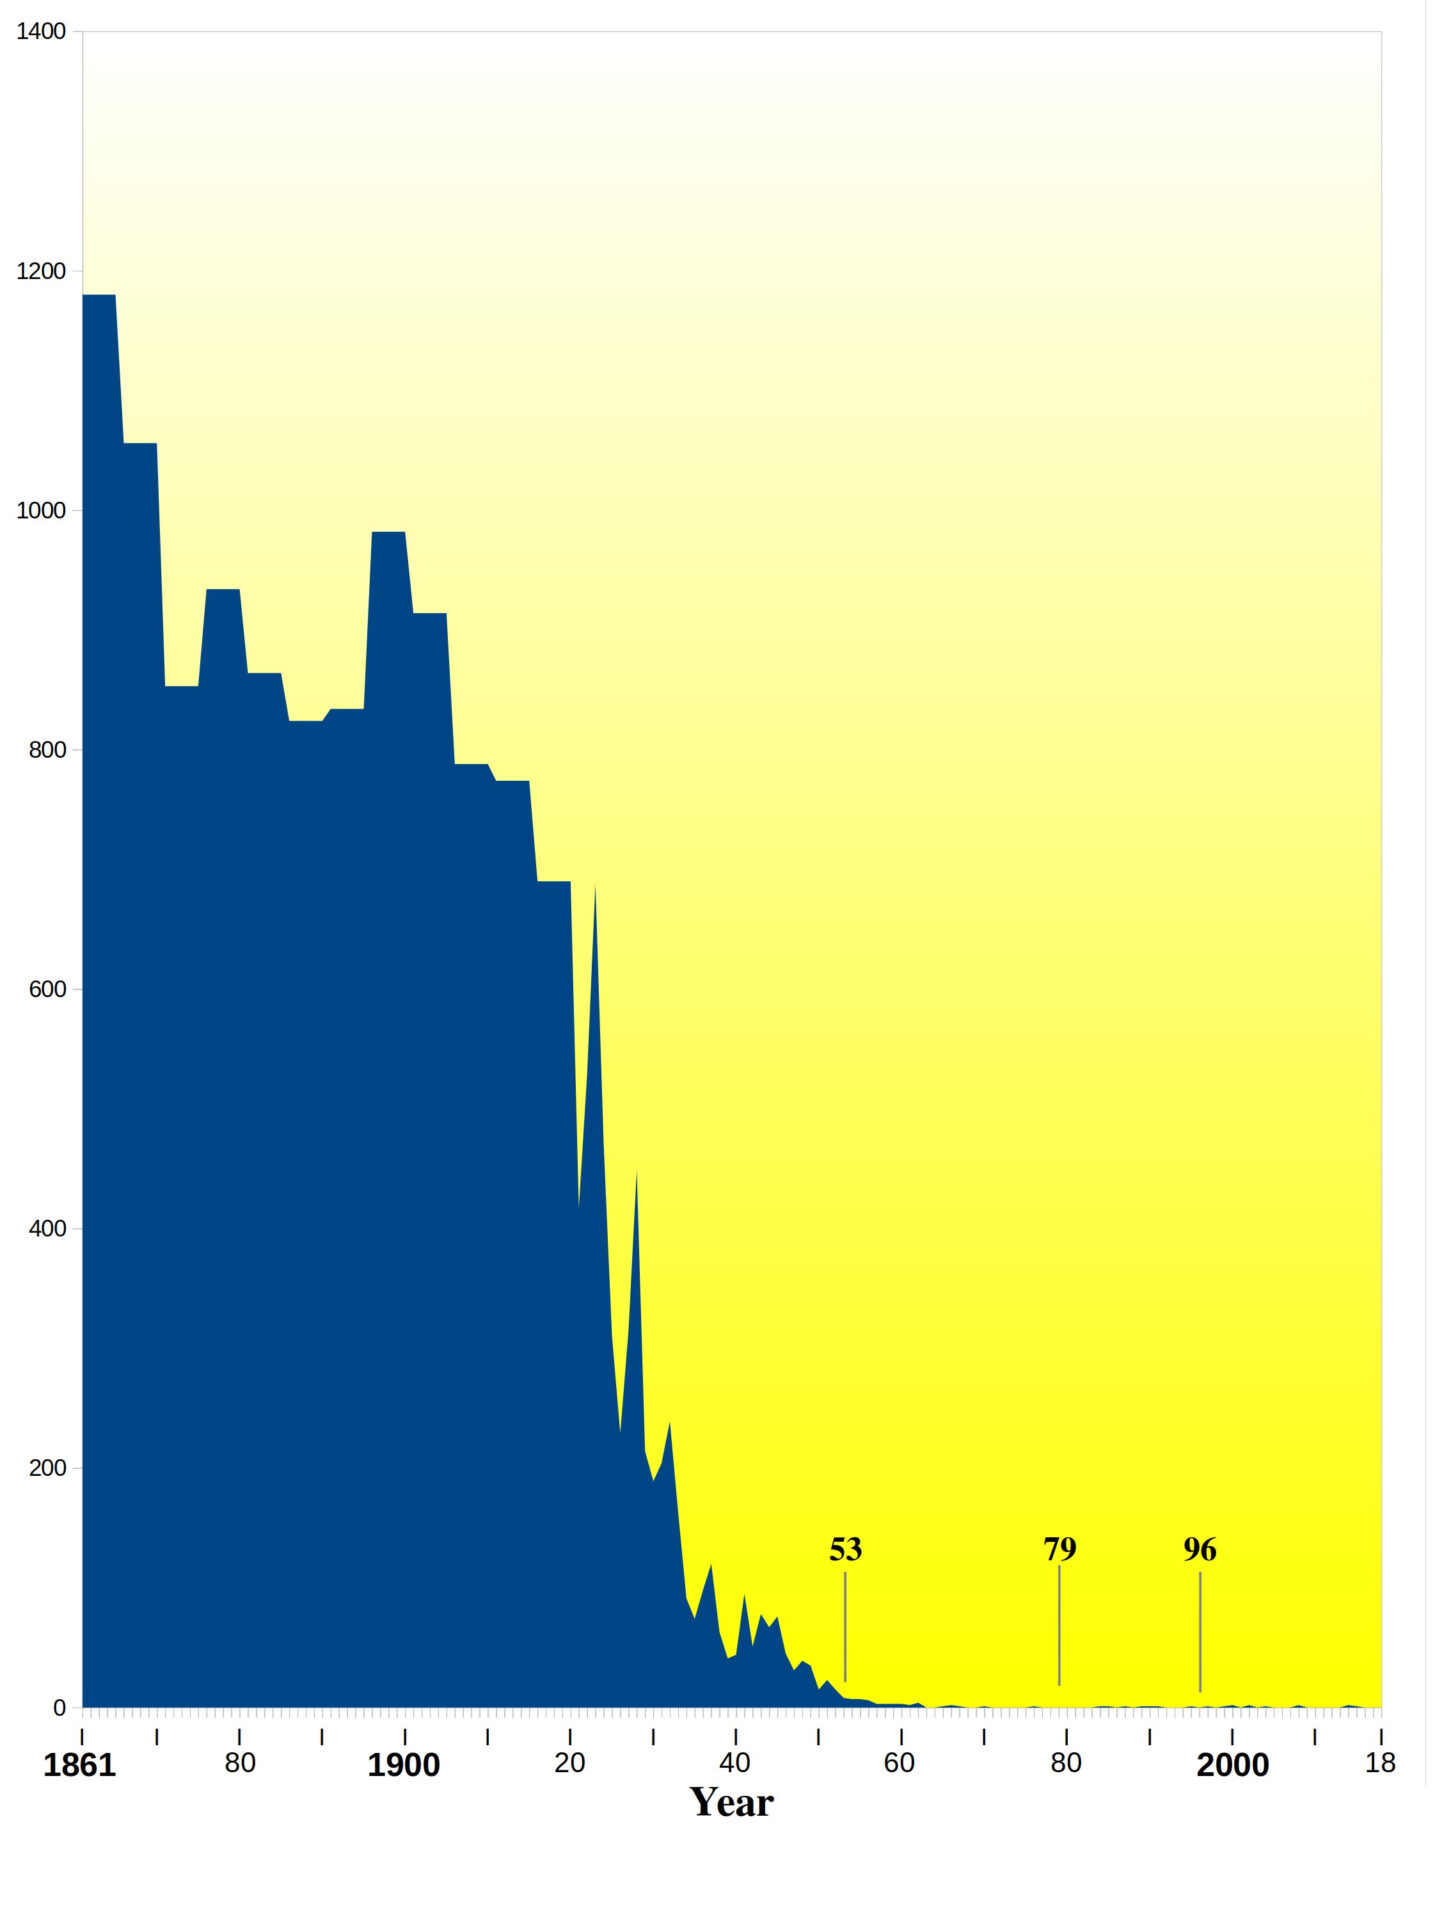
Graph 16.5: Sweden whooping cough deaths from 1861 to 2018. (c/o Jordan Henderson from the essay “Vaccine Evangelists, Apostates, and Apologists: Part 5,” https://jordanhenderson.substack.com/p/vaccine-evangelists-apostates-and-7f5, Historical Series of the Official Statistics of Sweden; various volumes, WHO Mortality Database.) *Tenth Anniversary Edition Only
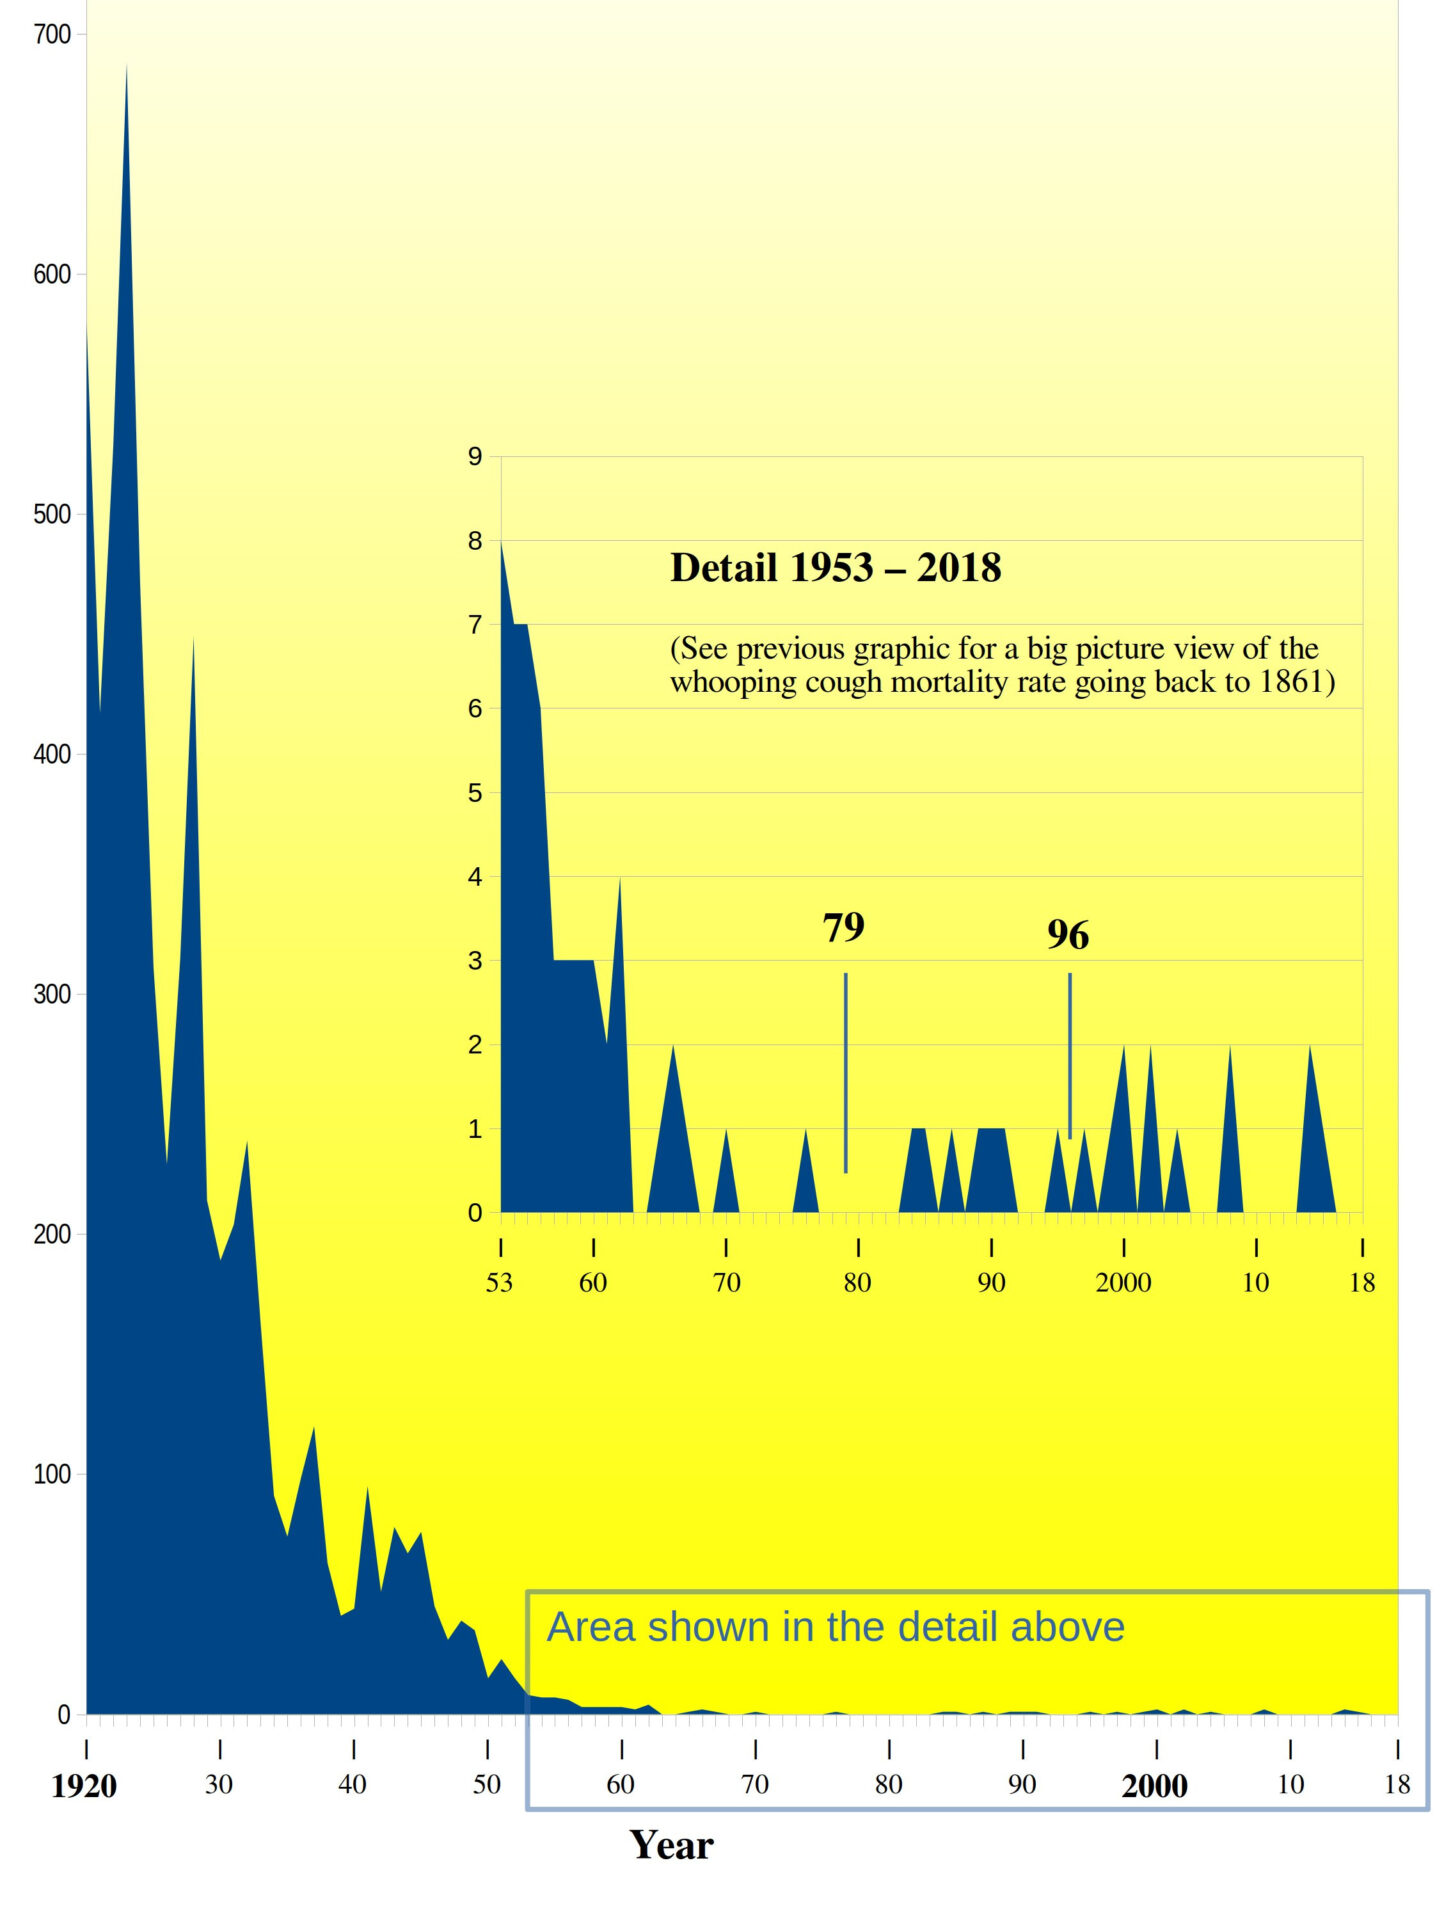
Graph 16.6: Sweden whooping cough deaths from 1920 to 2018; Detailed view 1953 to 2018
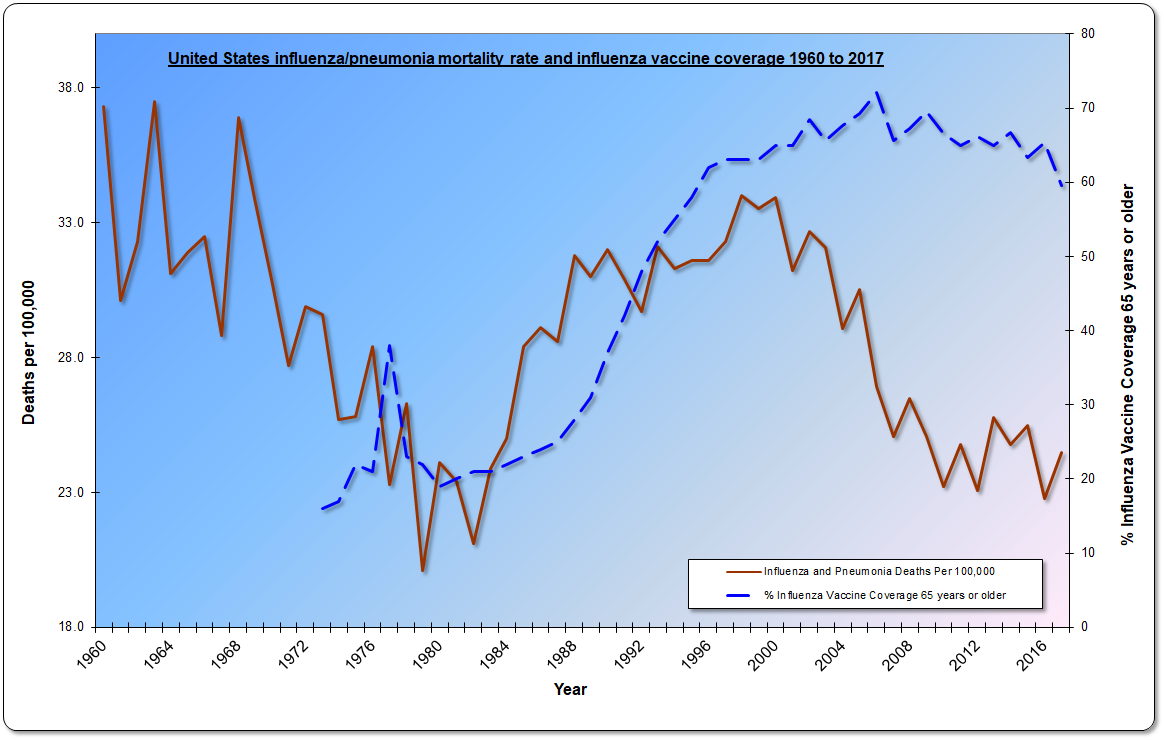
Graph 16.7: United States influenza/pneumonia mortality rate and influenza vaccine coverage from 1960 to 2017. (Chapter B, Vital Statistics and Health and Medical Care, Vital Statistics, B 149–166, p. 58; Leading Causes of Death, 1900–1998, http://www.cdc.gov/nchs/data/dvs/lead1900_98.pdf; Vital Statistics of the United States 1992 Volume II—Mortality Part A, U.S. Department of Health and Human Services, 1996, p. 12, various National Vital Statistics Reports 2001-2019; Impact of Influenza Vaccination on Seasonal Mortality in the US Elderly Population, Archives of Internal Medicine, vol. 165, February 14, 2005; Flu Vaccination Coverage, United States, 2019–20 Influenza Season, https://www.cdc.gov/flu/fluvaxview/coverage-1920estimates.htm; various CDC MMWR and other reports) *Tenth Anniversary Edition Only
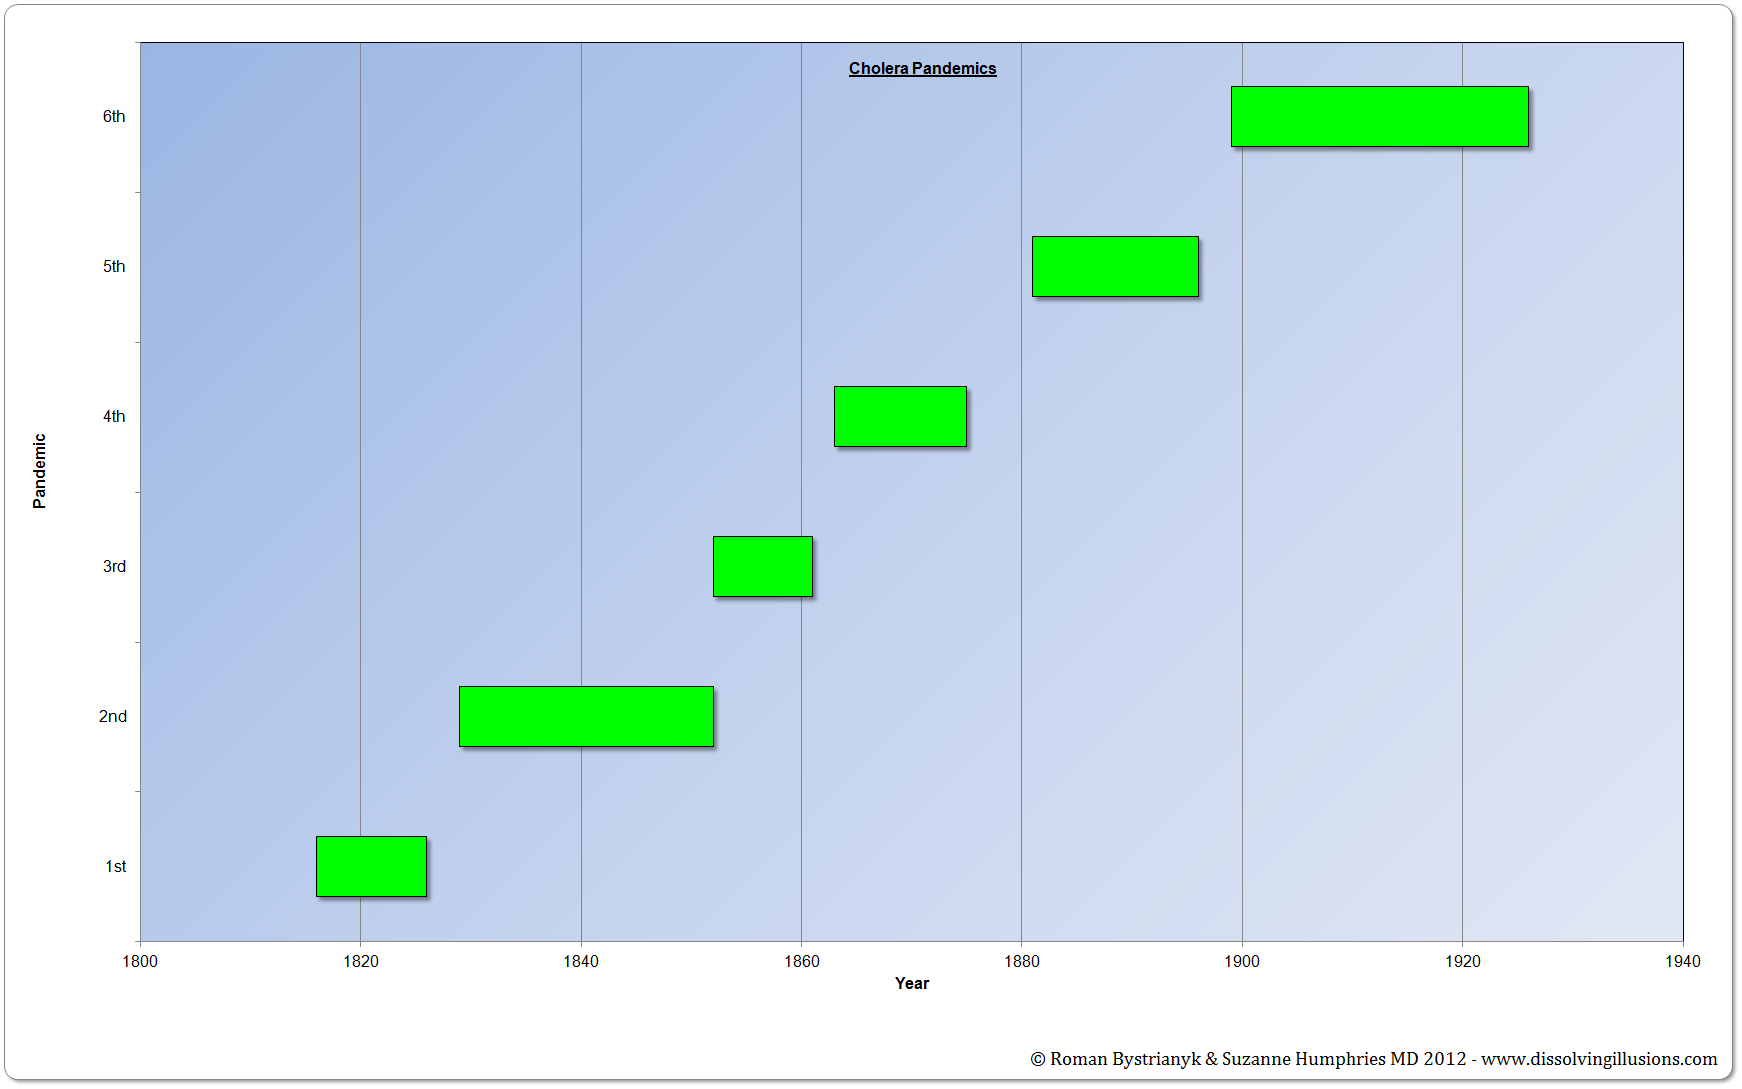
Graph 3.3: Six cholera pandemics. The first pandemic started in 1816, and the last ended in 1926. *First Edition: Graph 3.1
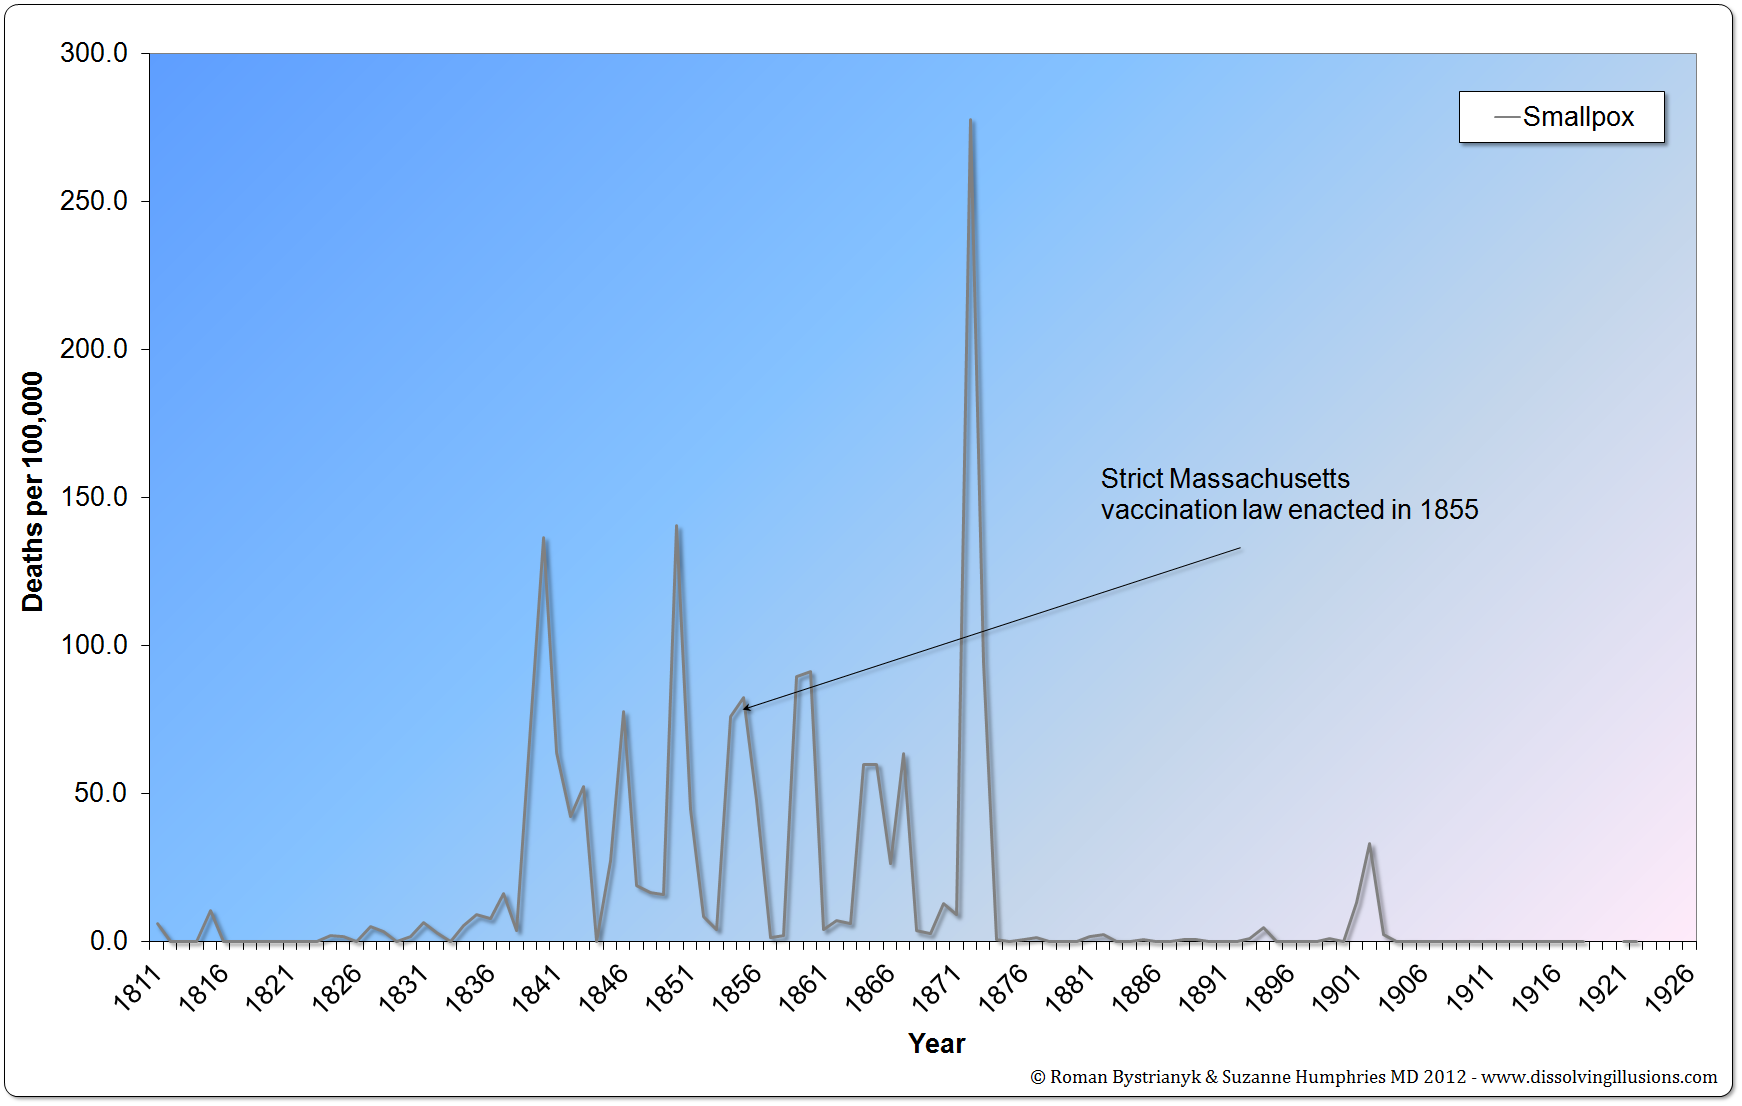
4.2: Boston smallpox mortality rate from 1811 to 1926. (Dozens of reports from the Board of Health of the City of Boston) *First Edition: Graph 4.1
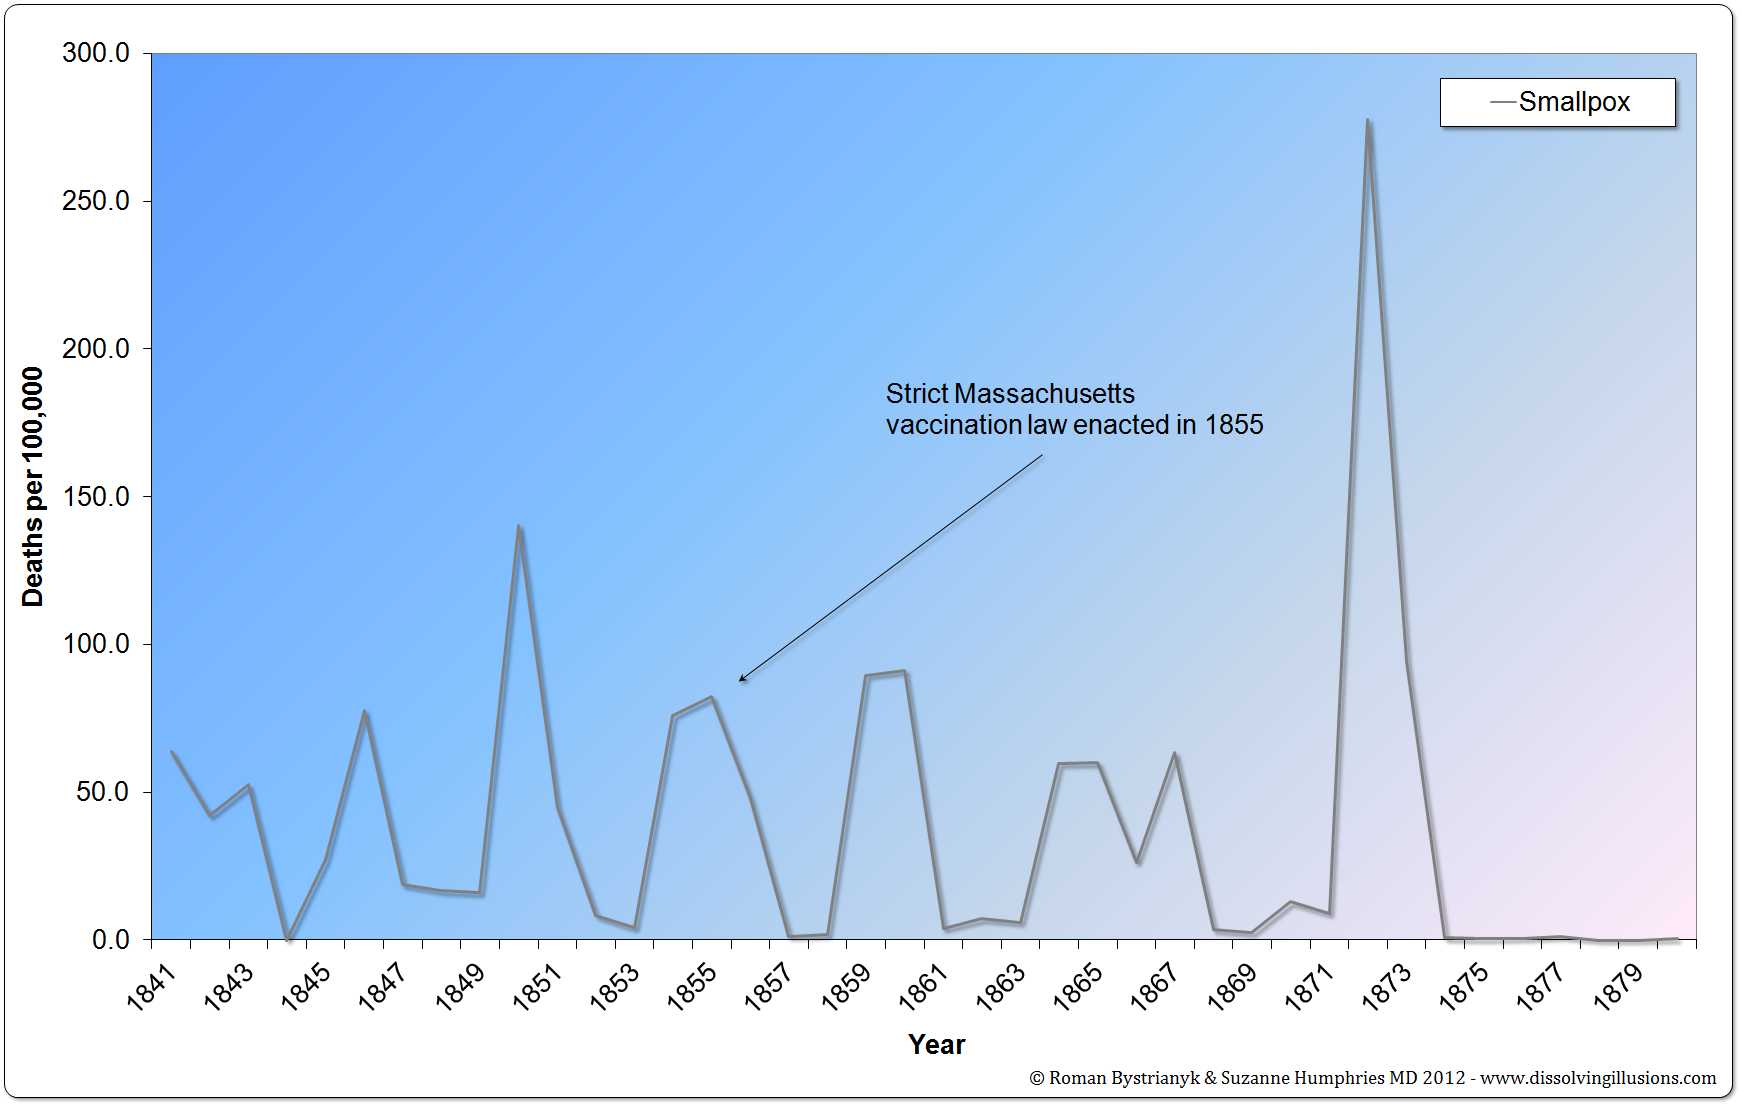
Graph 4.3: Boston smallpox mortality rate from 1841 to 1880. (Dozens of reports from the Board of Health of the City of Boston) *First Edition: Graph 4.2
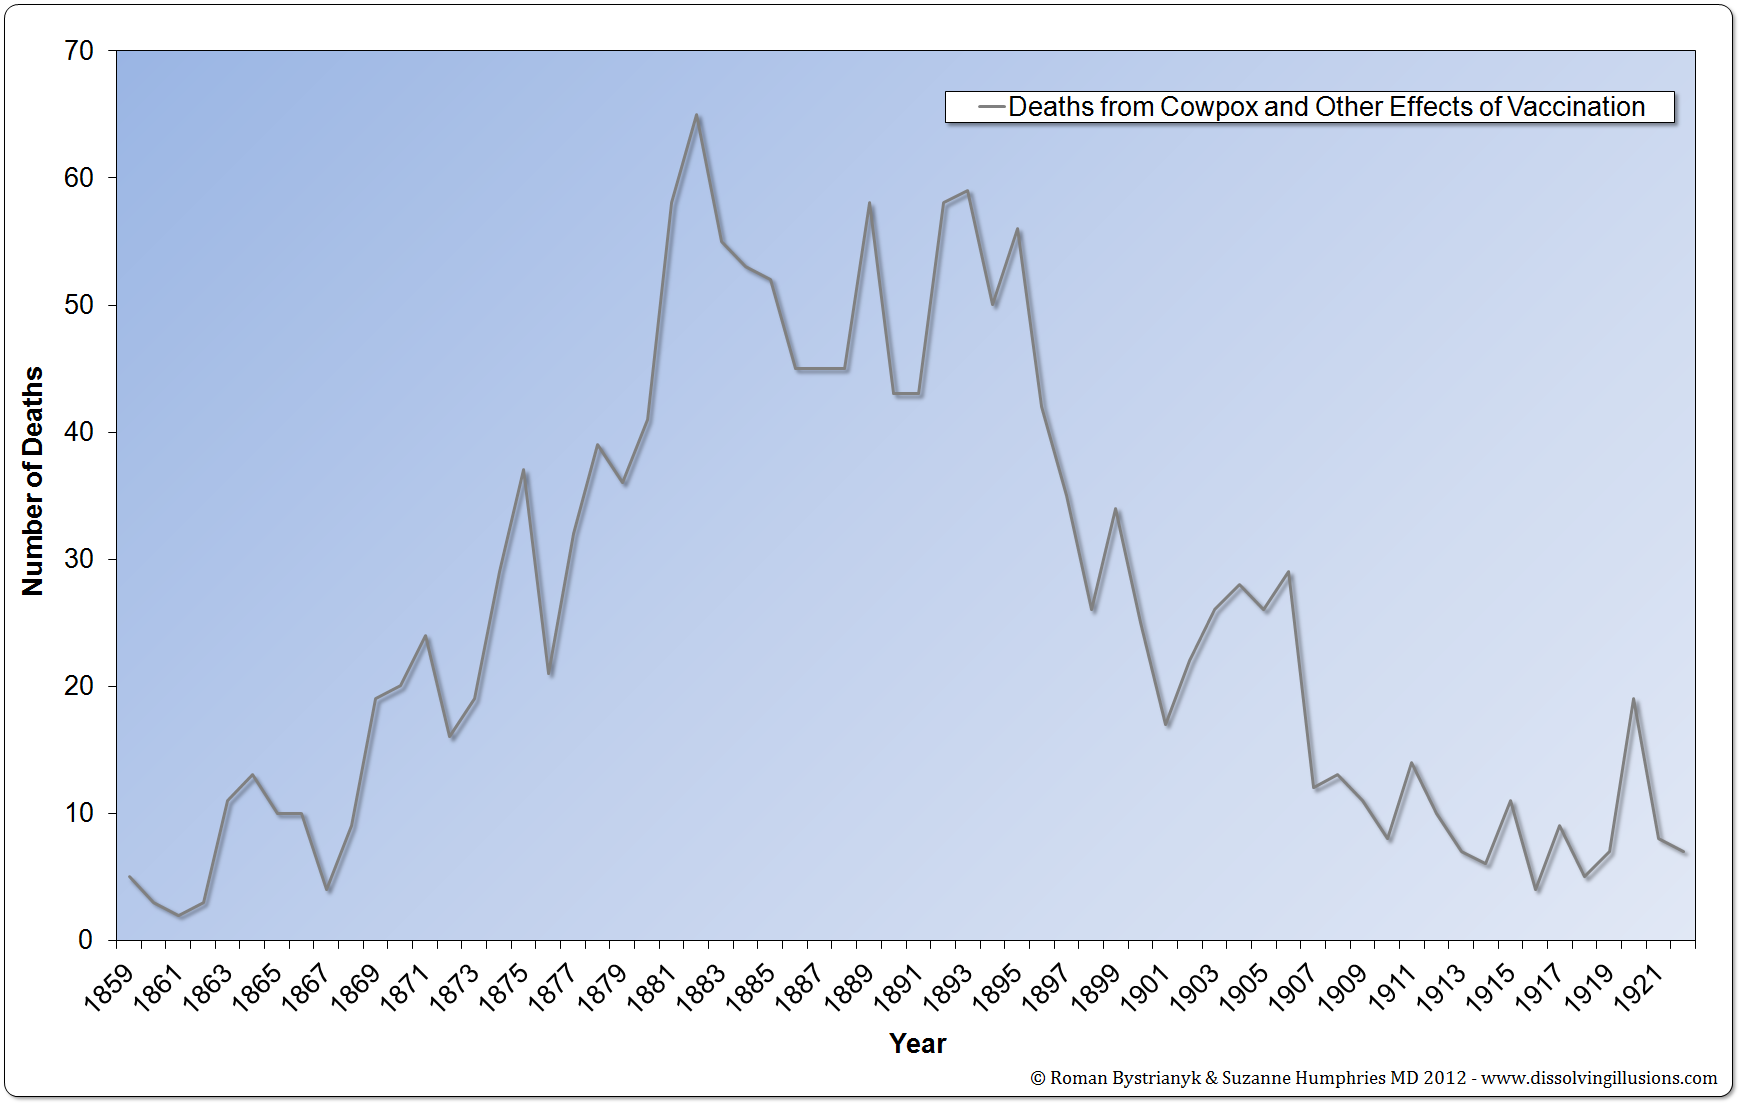
Graph 4.4: England and Wales total deaths from cowpox and other effects of vaccination from 1859 to 1922. (Written answer by Lord E. Percy to Parliamentary question addressed by Mr. March, MP, to the Minister to Health on July 16, 1923; Leicester: Sanitation Versus Vaccination, J. T. Biggs, JP, 1912, pp. 184–185) *First Edition: Graph 4.3
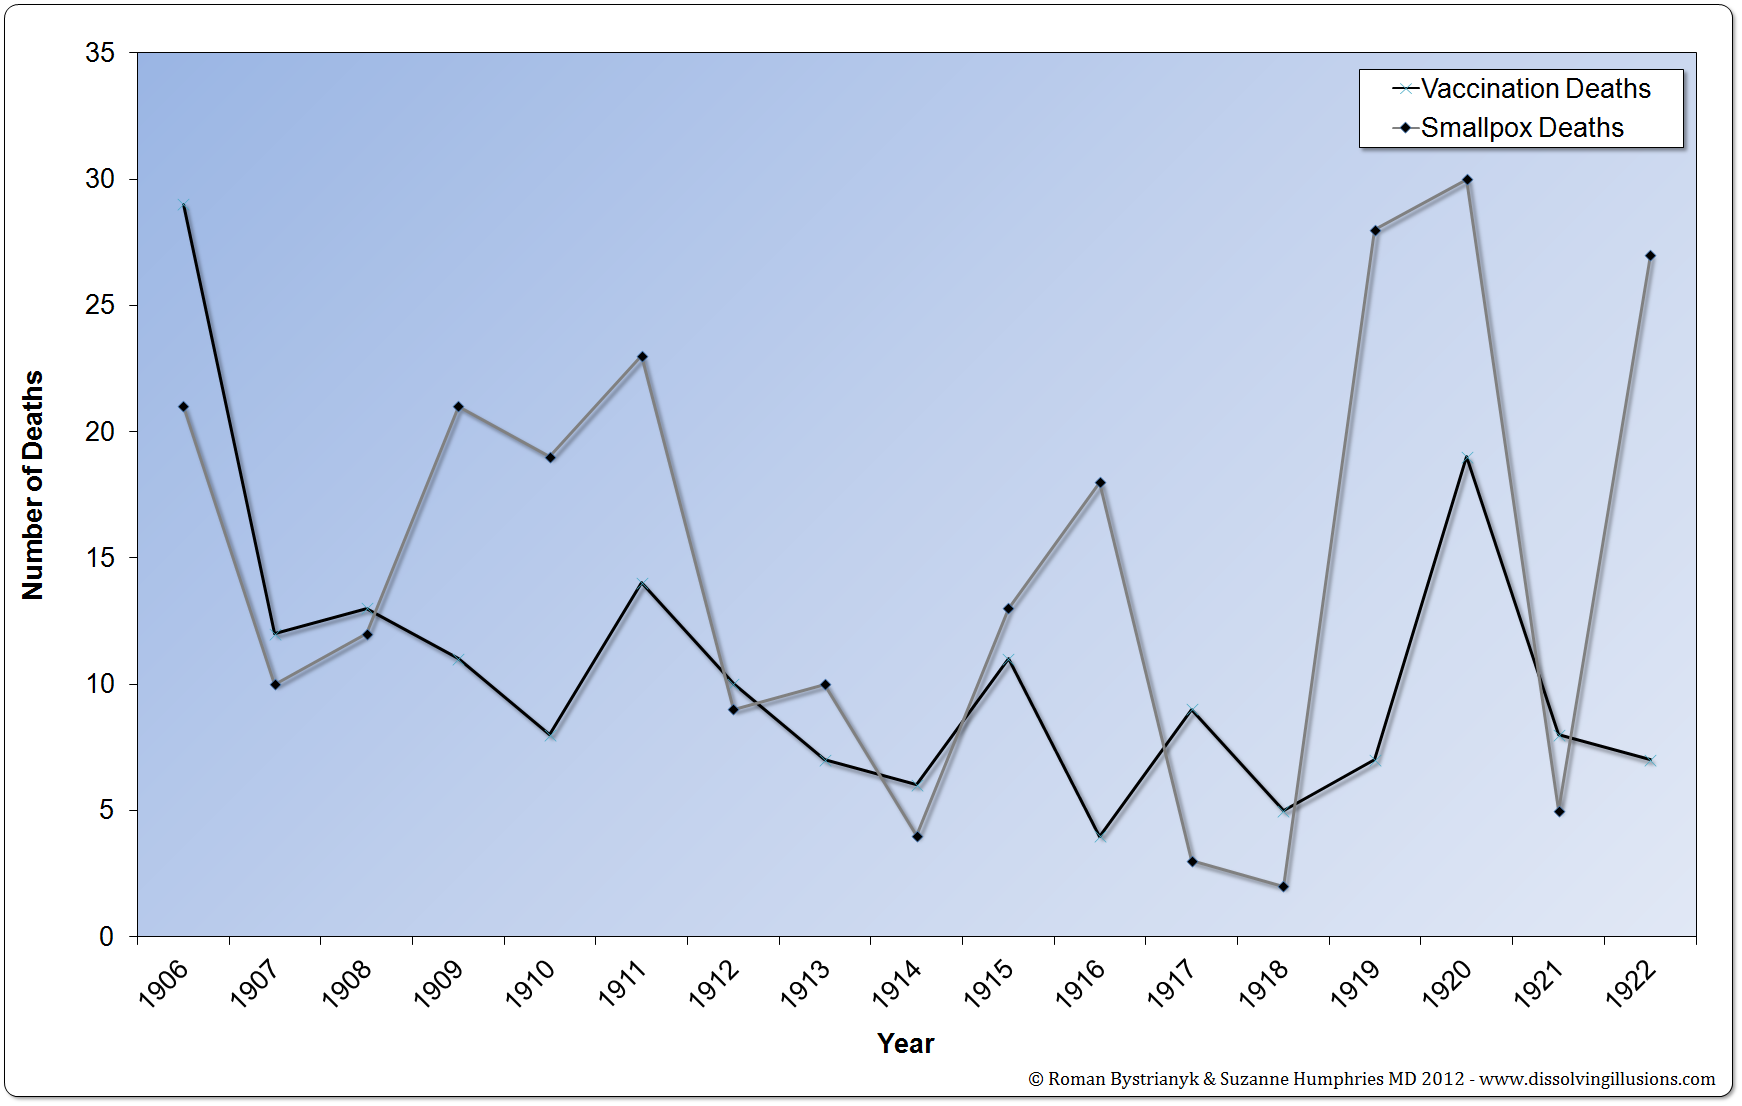
Graph 4.5: England and Wales smallpox deaths vs. smallpox vaccination deaths from 1906 to 1922. (Written answer by Lord E. Percy to Parliamentary question addressed by Mr. March, MP, to the Minister to Health on July 16, 1923) *First Edition: Graph 4.4
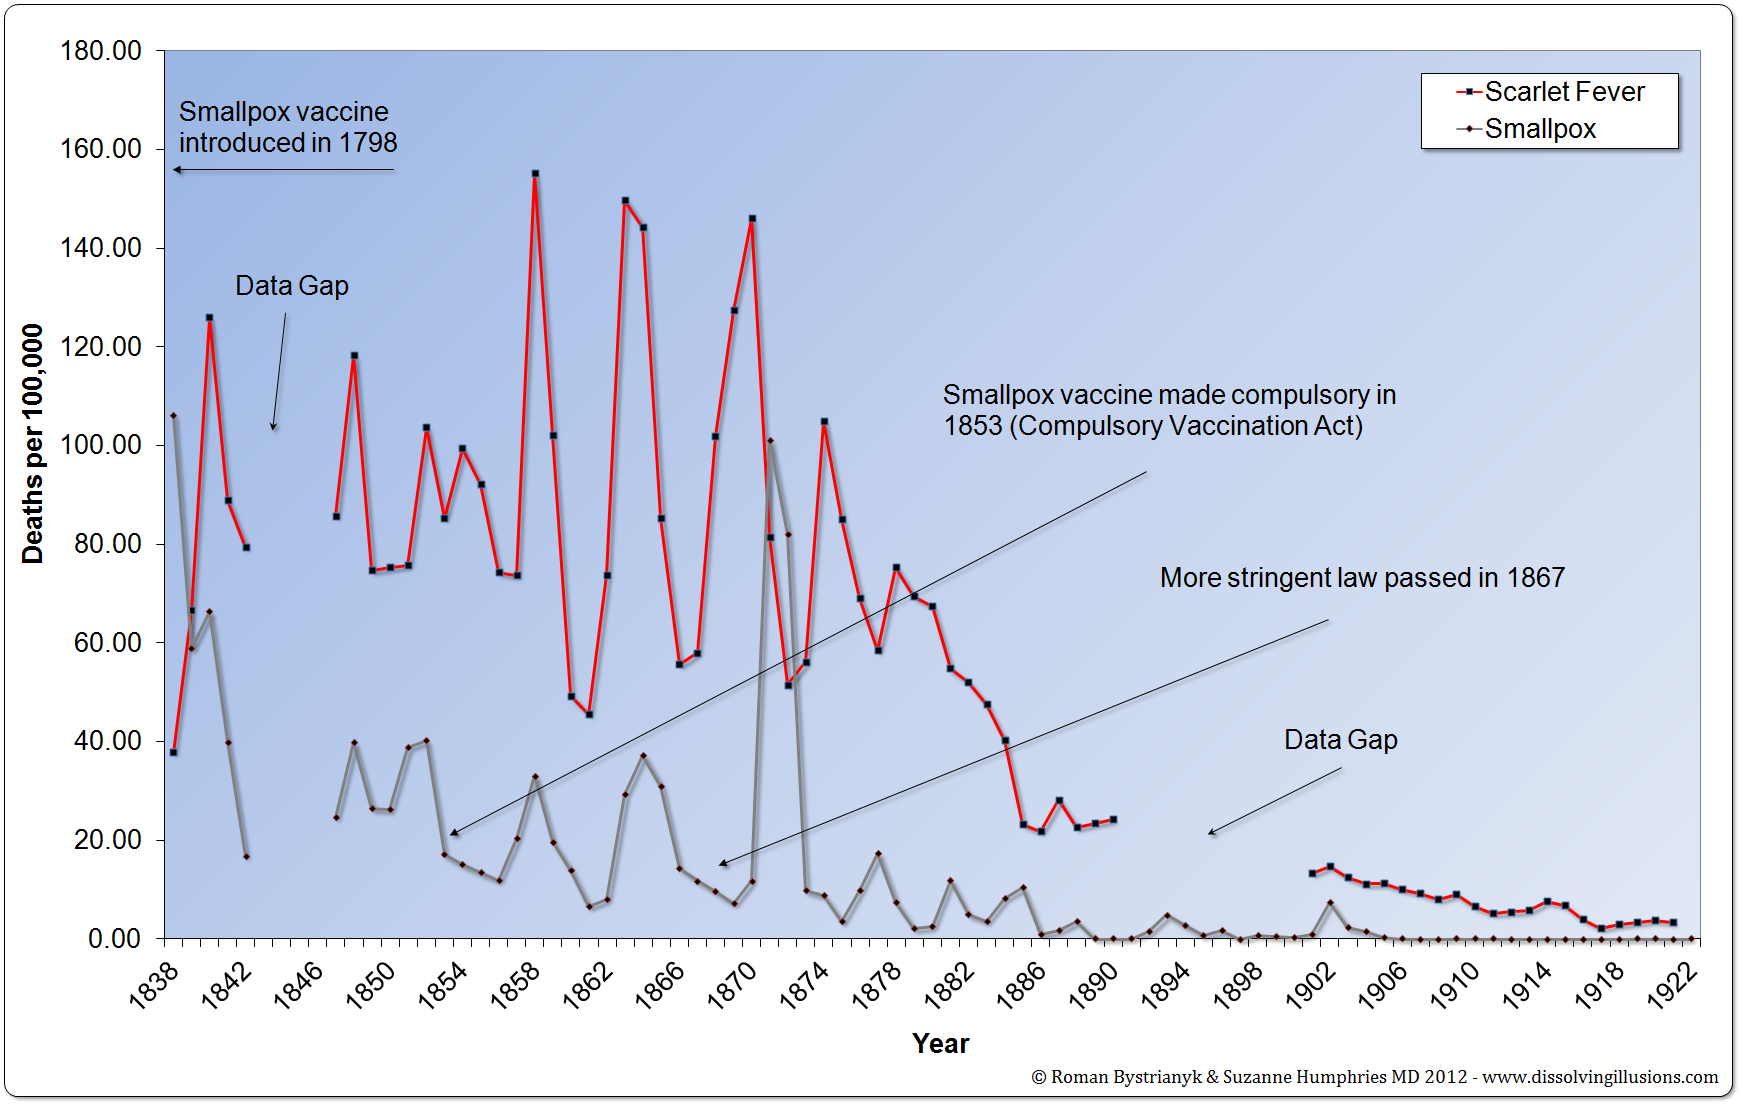
Graph 4.6: England and Wales smallpox and scarlet fever mortality rates from 1838 to 1922. (Record of mortality in England and Wales for 95 years as provided by the Office of National Statistics, published 1997; Report to The Honourable Sir George Cornewall Lewis, Bart, MP, Her Majesty’s Principal Secretary of State for the Home Department, June 30, 1860, pp. a4, 205; Written answer by Lord E. Percy to Parliamentary question addressed by Mr. March, MP, to the Minister to Health on July 16, 1923; Essay on Vaccination by Charles T. Pearce, MD, Member of the Royal College of Surgeons of England) *First Edition: Graph 4.5
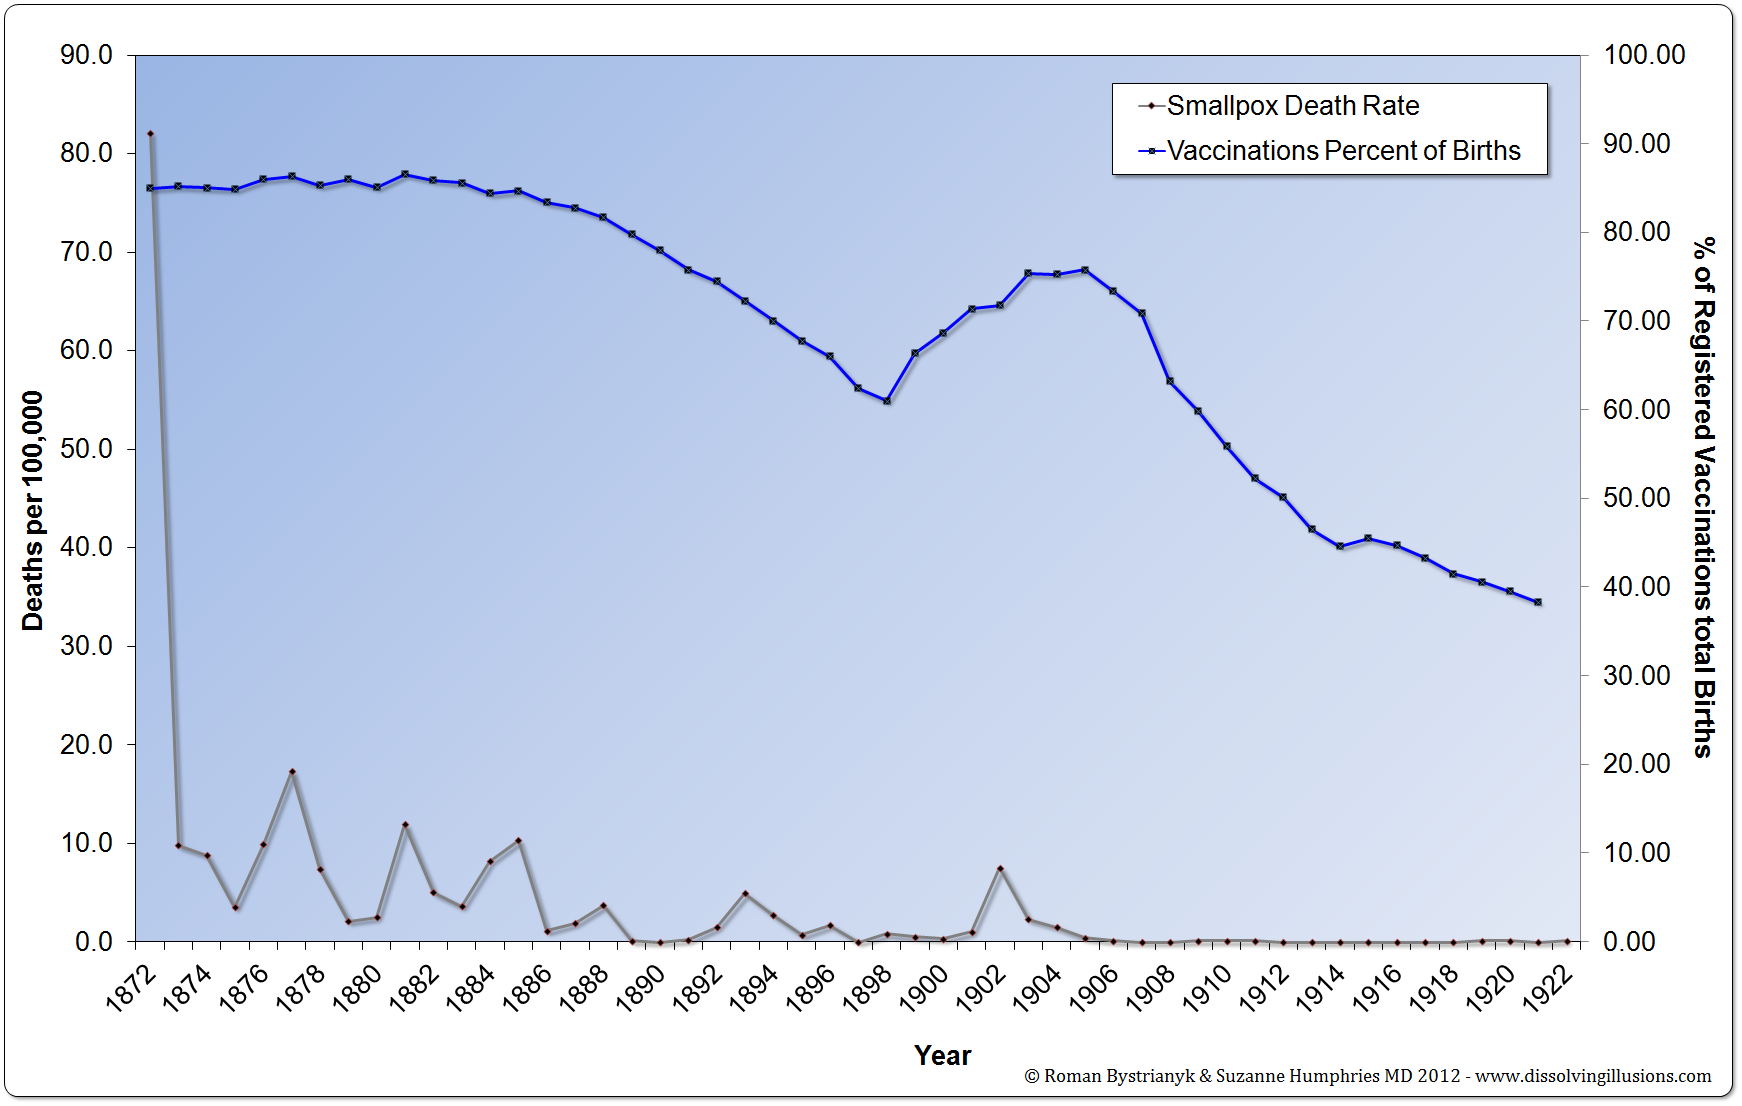
Graph 4.7: England and Wales smallpox mortality rate vs. smallpox vaccine coverage rates from 1872 to 1922. (Written answer by Lord E. Percy to Parliamentary question addressed by Mr. March, MP, to the Minister to Health on July 16, 1923) *First Edition: Graph 4.6
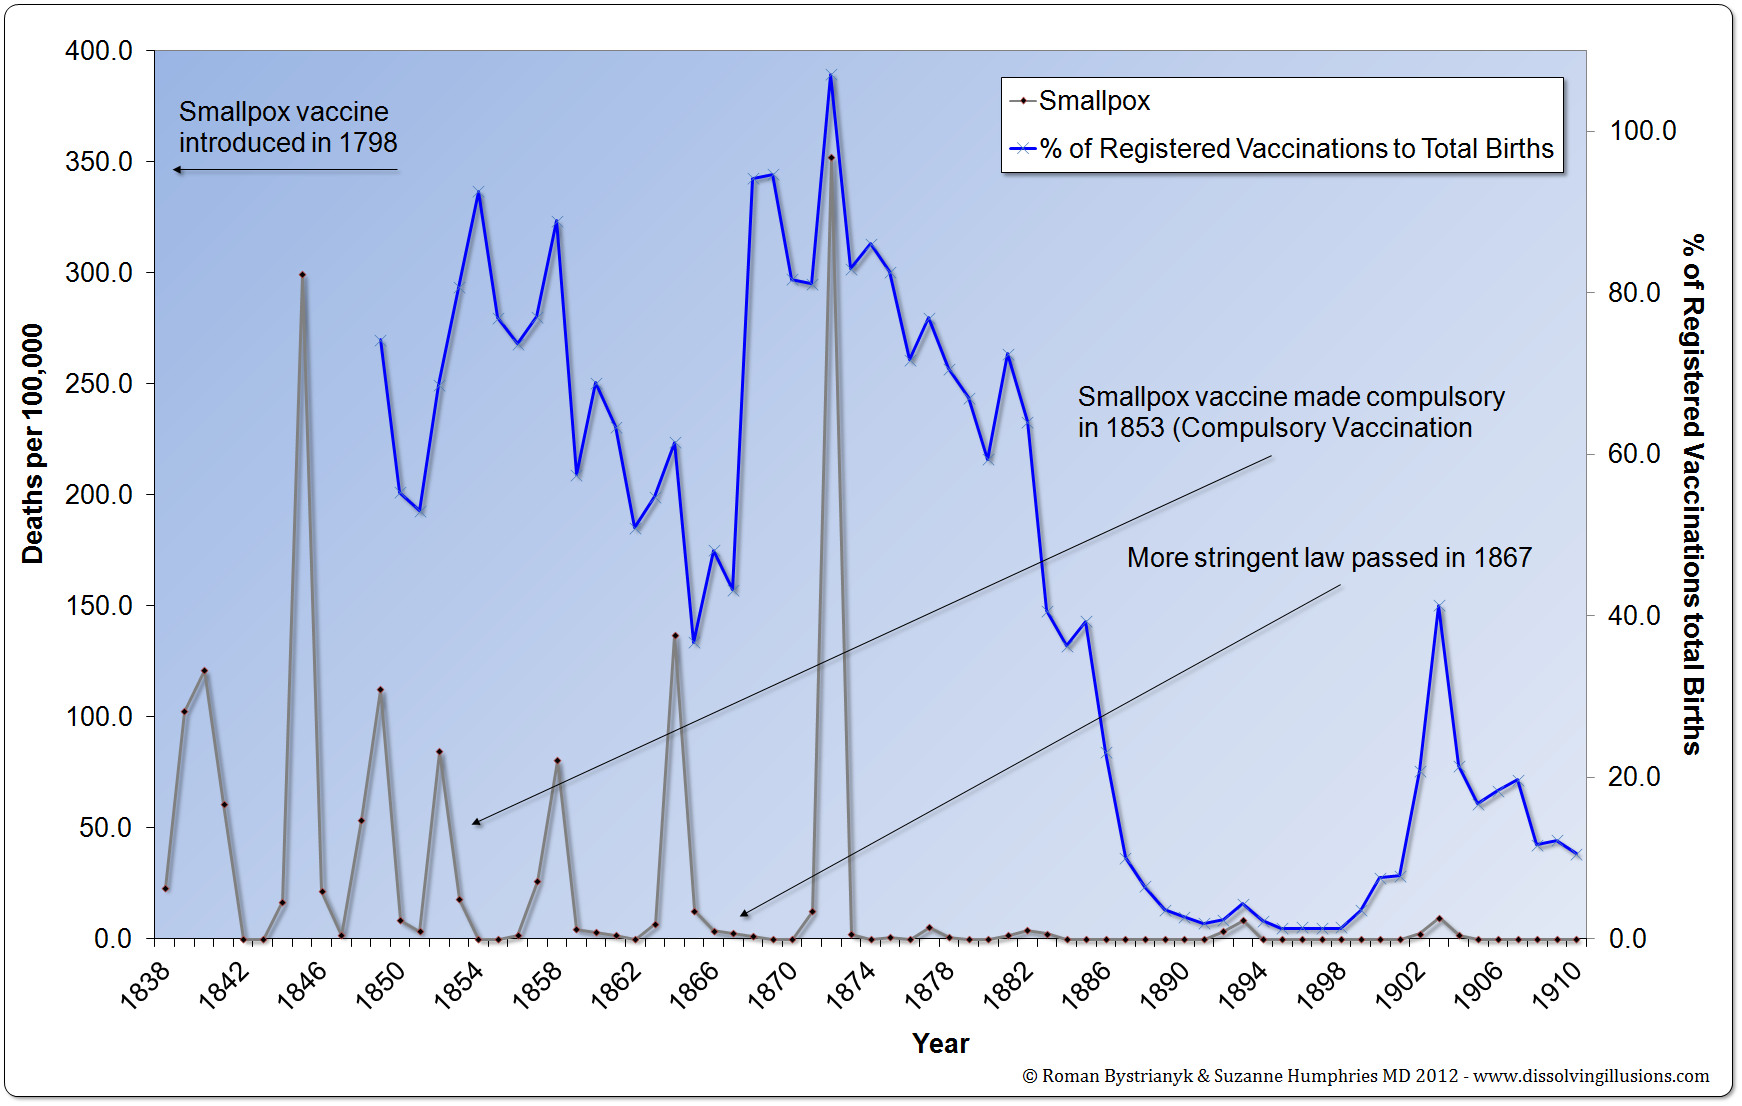
Graph 10.1: Leicester, England, smallpox mortality rate vs. smallpox vaccination coverage from 1838 to 1910. (Leicester: Sanitation Versus Vaccination, J. T. Biggs, JP, 1912, pp. 720–722) *First Edition: Graph 7.1
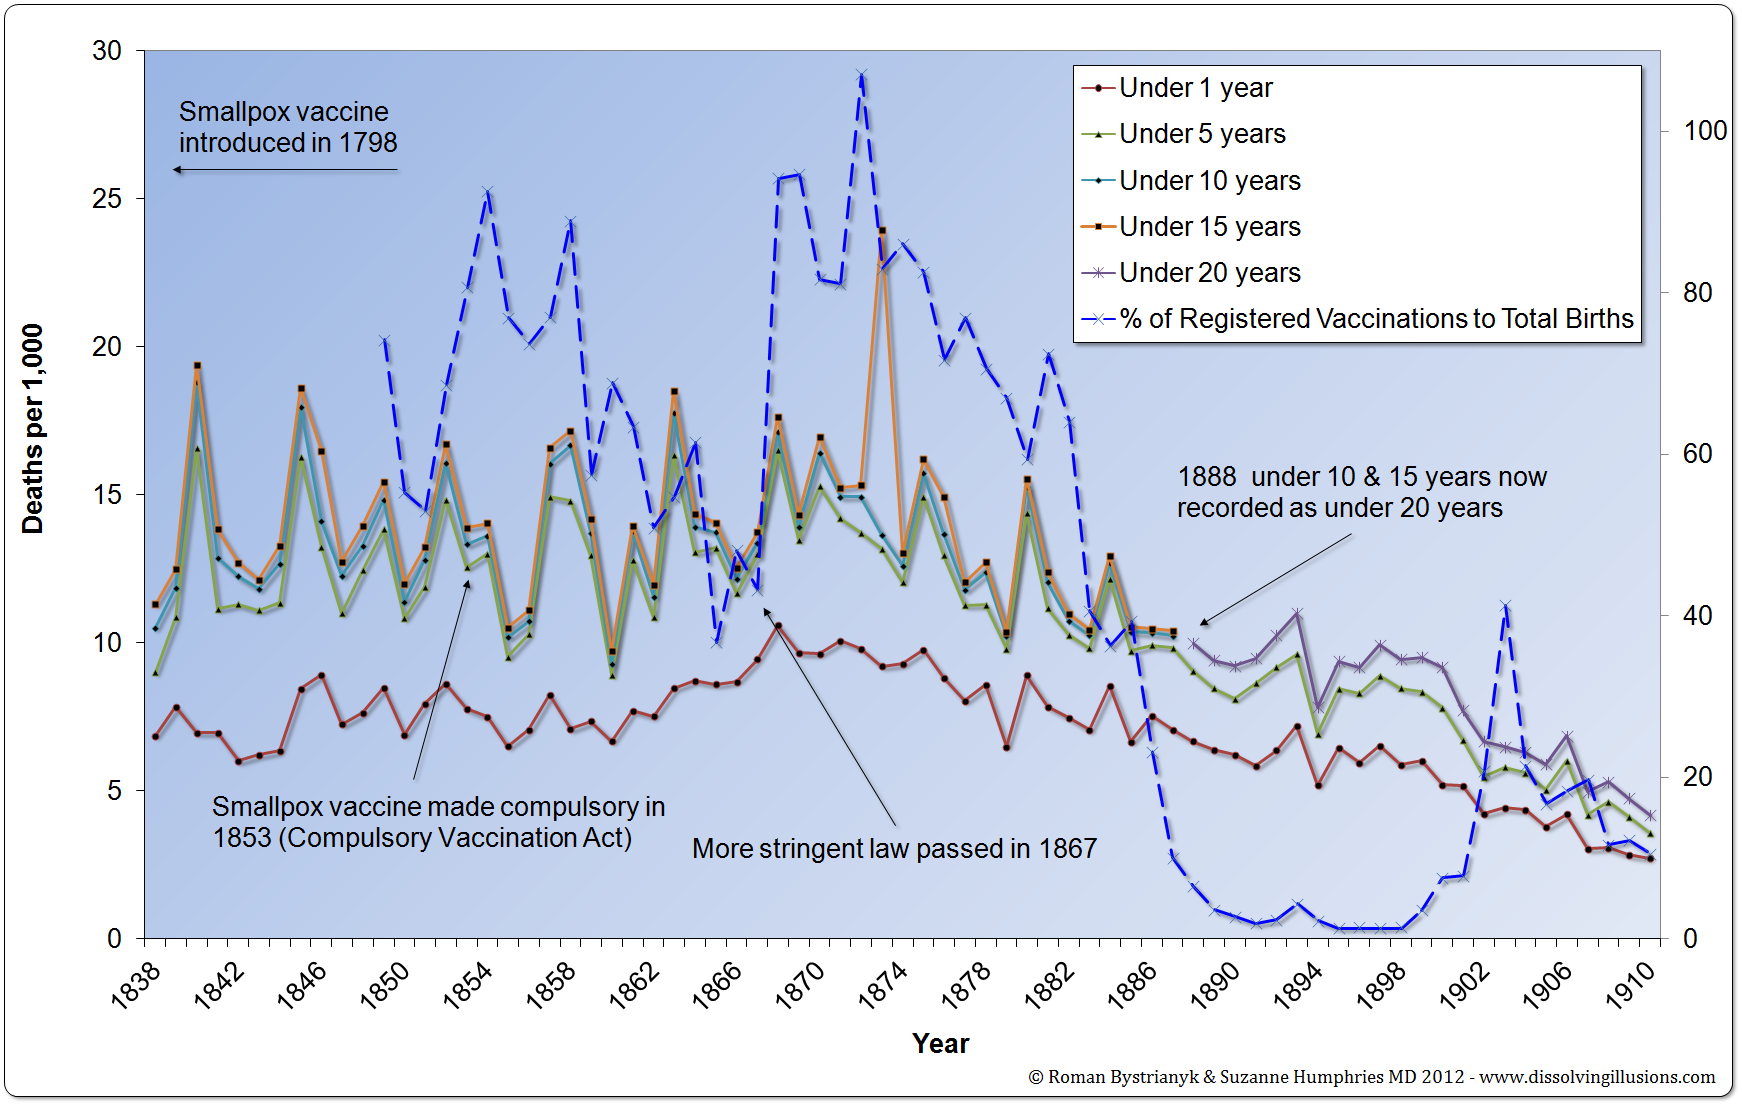
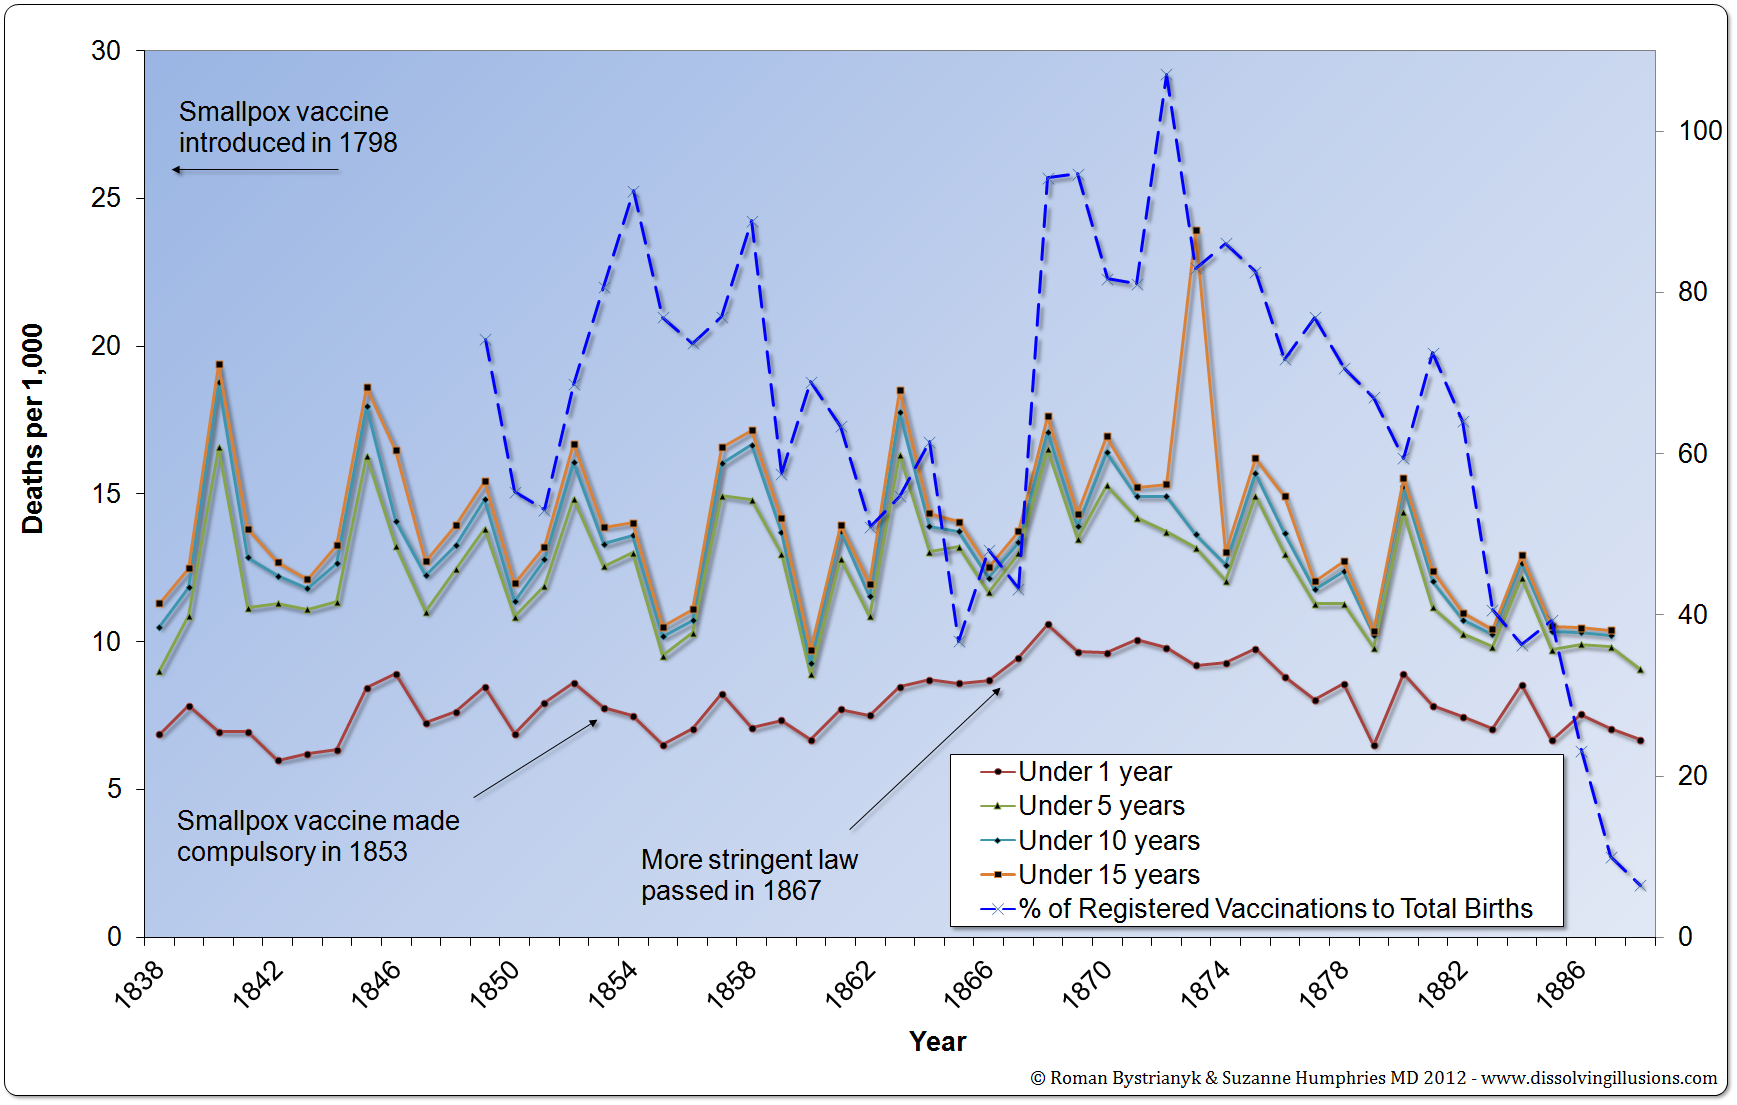
Graph 10.2: Leicester, England, mortality rates for various age groups vs. smallpox vaccination coverage from 1838 to 1910. (Leicester: Sanitation Versus Vaccination, J. T. Biggs, JP, 1912, pp. 720–722) *First Edition: Graph 7.2
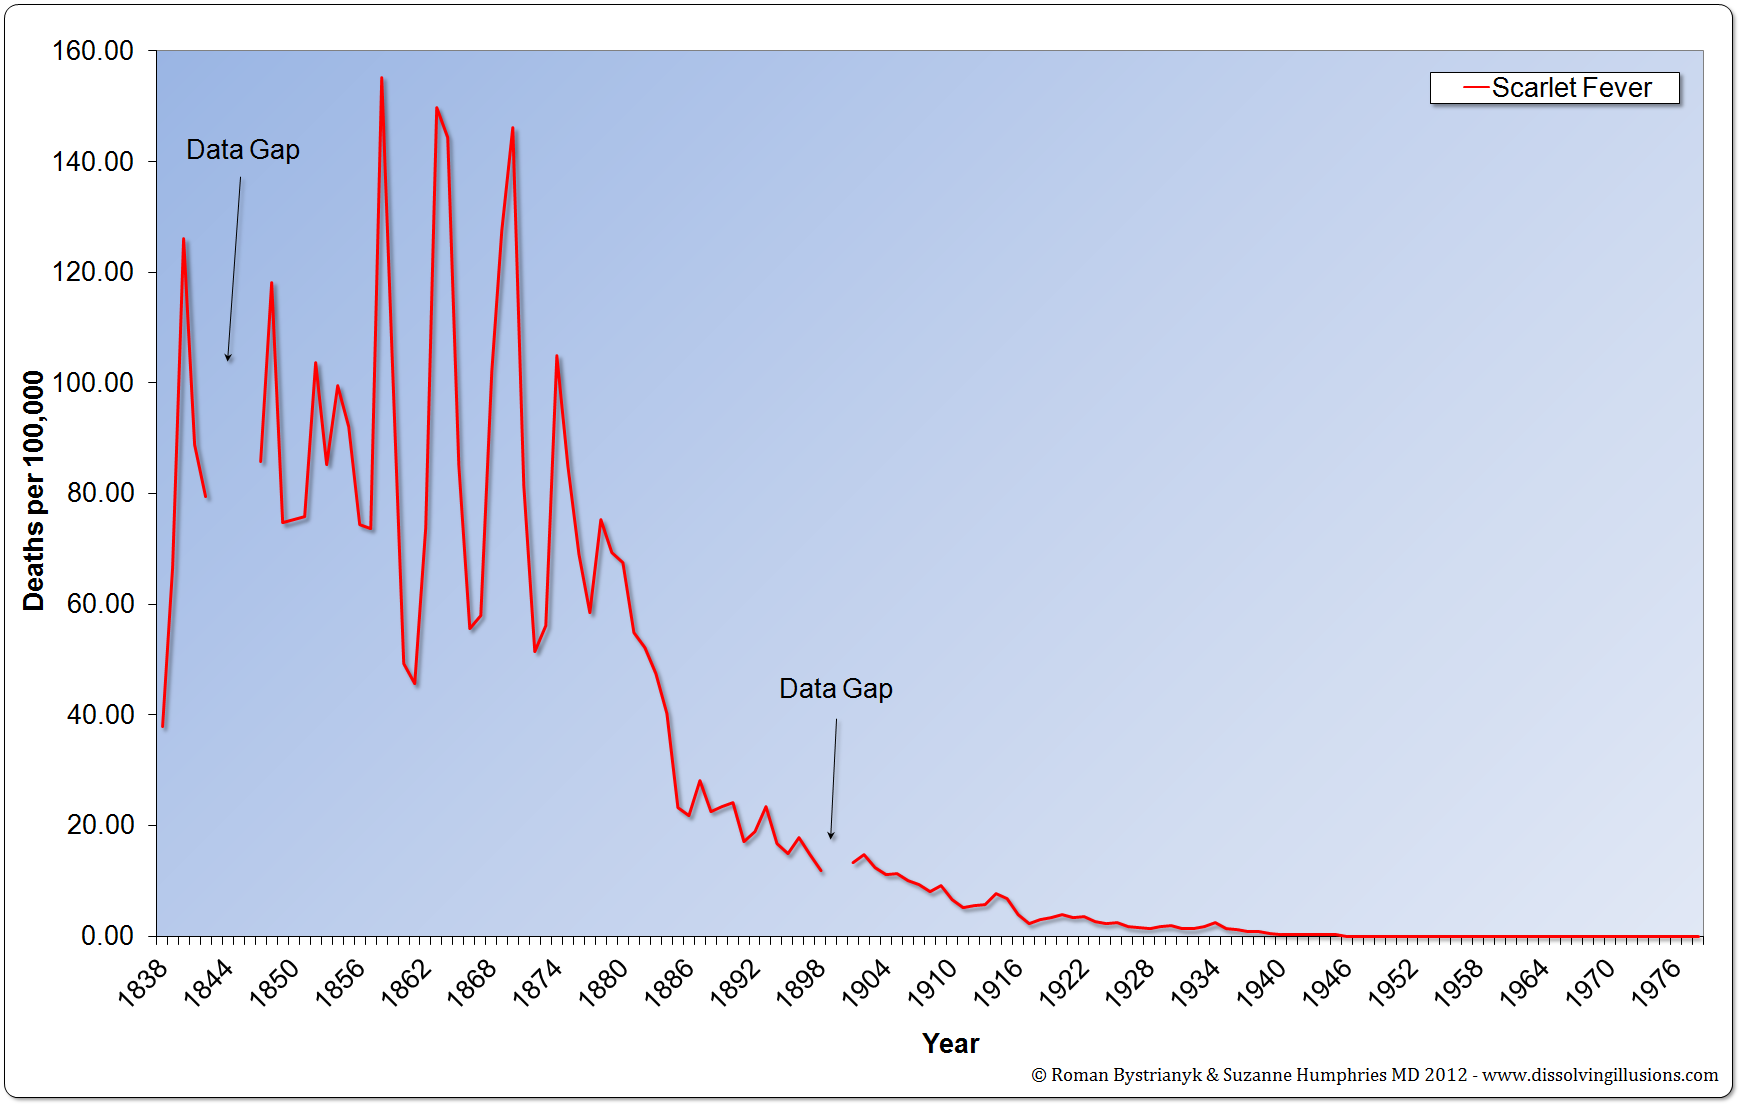
Graph 14.1: England and Wales scarlet fever mortality rate from 1838 to 1978. (Record of mortality in England and Wales for 95 years as provided by the Office of National Statistics, published 1997; Report to The Honourable Sir George Cornewall Lewis, Bart, MP, Her Majesty’s Principal Secretary of State for the Home Department, June 30, 1860, pp a4, 205; Essay on Vaccination by Charles T. Pearce, MD, Member of the Royal College of Surgeons of England; Parliamentary Papers, the 62nd Annual Return of the Registrar General 1899 (1891–1898)) *First Edition: Graph 11.1
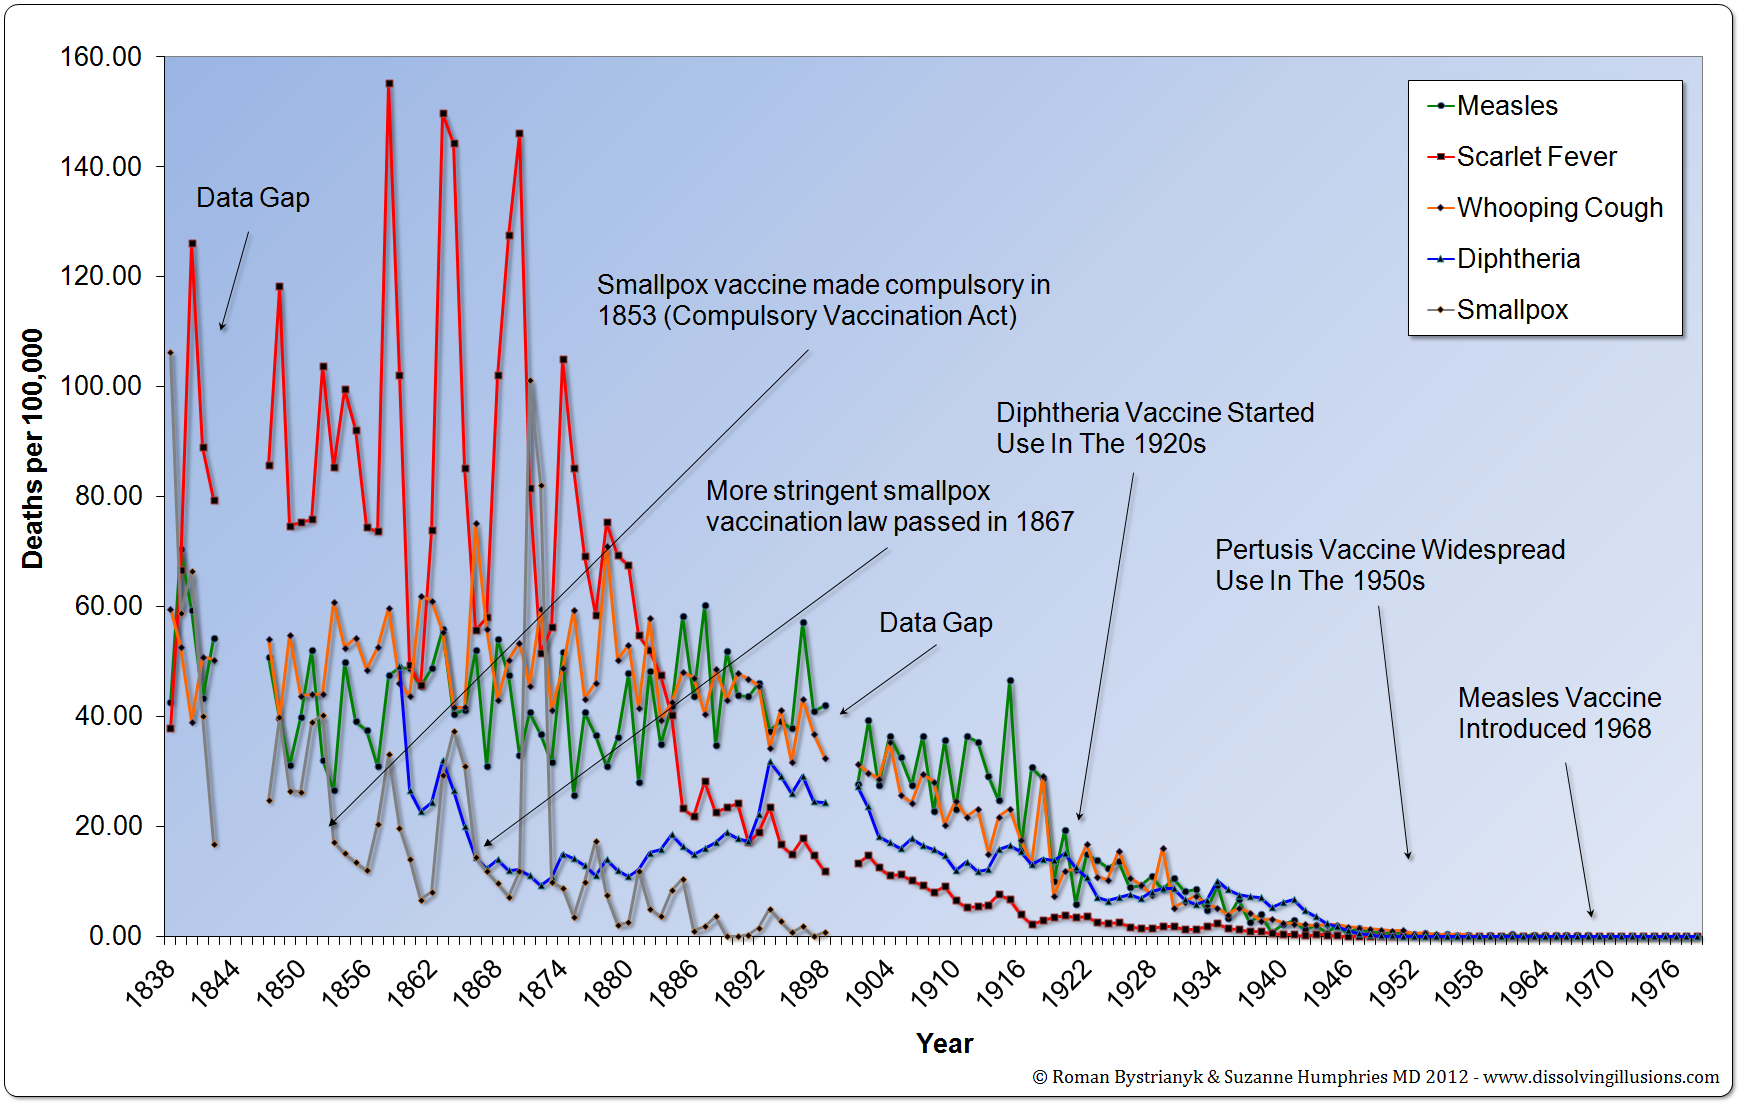
Graph 14.2: England and Wales mortality rates from various infectious diseases from 1838 to 1978. (Record of mortality in England and Wales for 95 years as provided by the Office of National Statistics, published 1997; Report to The Honourable Sir George Cornewall Lewis, Bart, MP, Her Majesty’s Principal Secretary of State for the Home Department, June 30, 1860, pp. a4, 205; Essay on Vaccination by Charles T. Pearce, MD, Member of the Royal College of Surgeons of England; Parliamentary Papers, the 62nd Annual Return of the Registrar General 1899 (1891–1898)) *First Edition: Graph 11.2
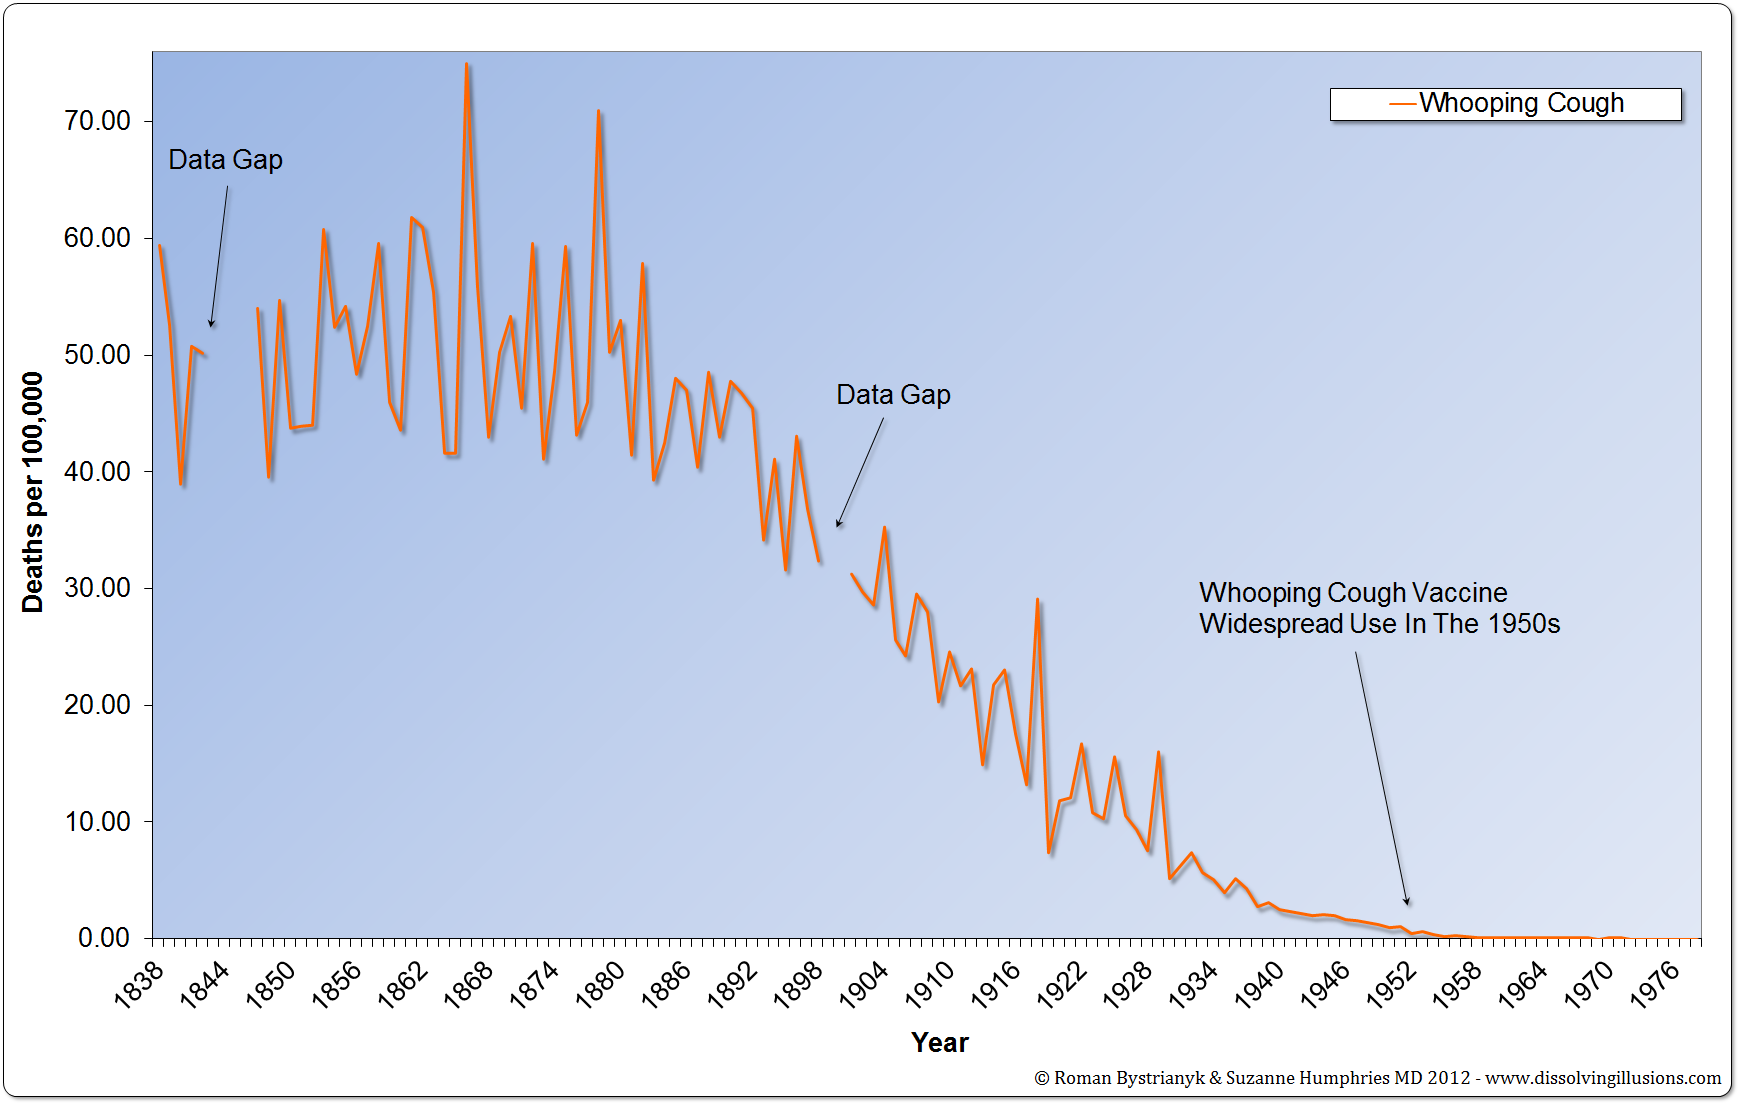
Graph 14.3: England and Wales whooping cough mortality rate from 1838 to 1978. (Record of mortality in England and Wales for 95 years as provided by the Office of National Statistics, published 1997; Report to The Honourable Sir George Cornewall Lewis, Bart, MP, Her Majesty’s Principal Secretary of State for the Home Department, June 30, 1860, pp. a4, 205; Essay on Vaccination by Charles T. Pearce, MD, Member of the Royal College of Surgeons of England; Parliamentary Papers, the 62nd Annual Return of the Registrar General 1899 (1891–1898)) *First Edition: Graph 11.3
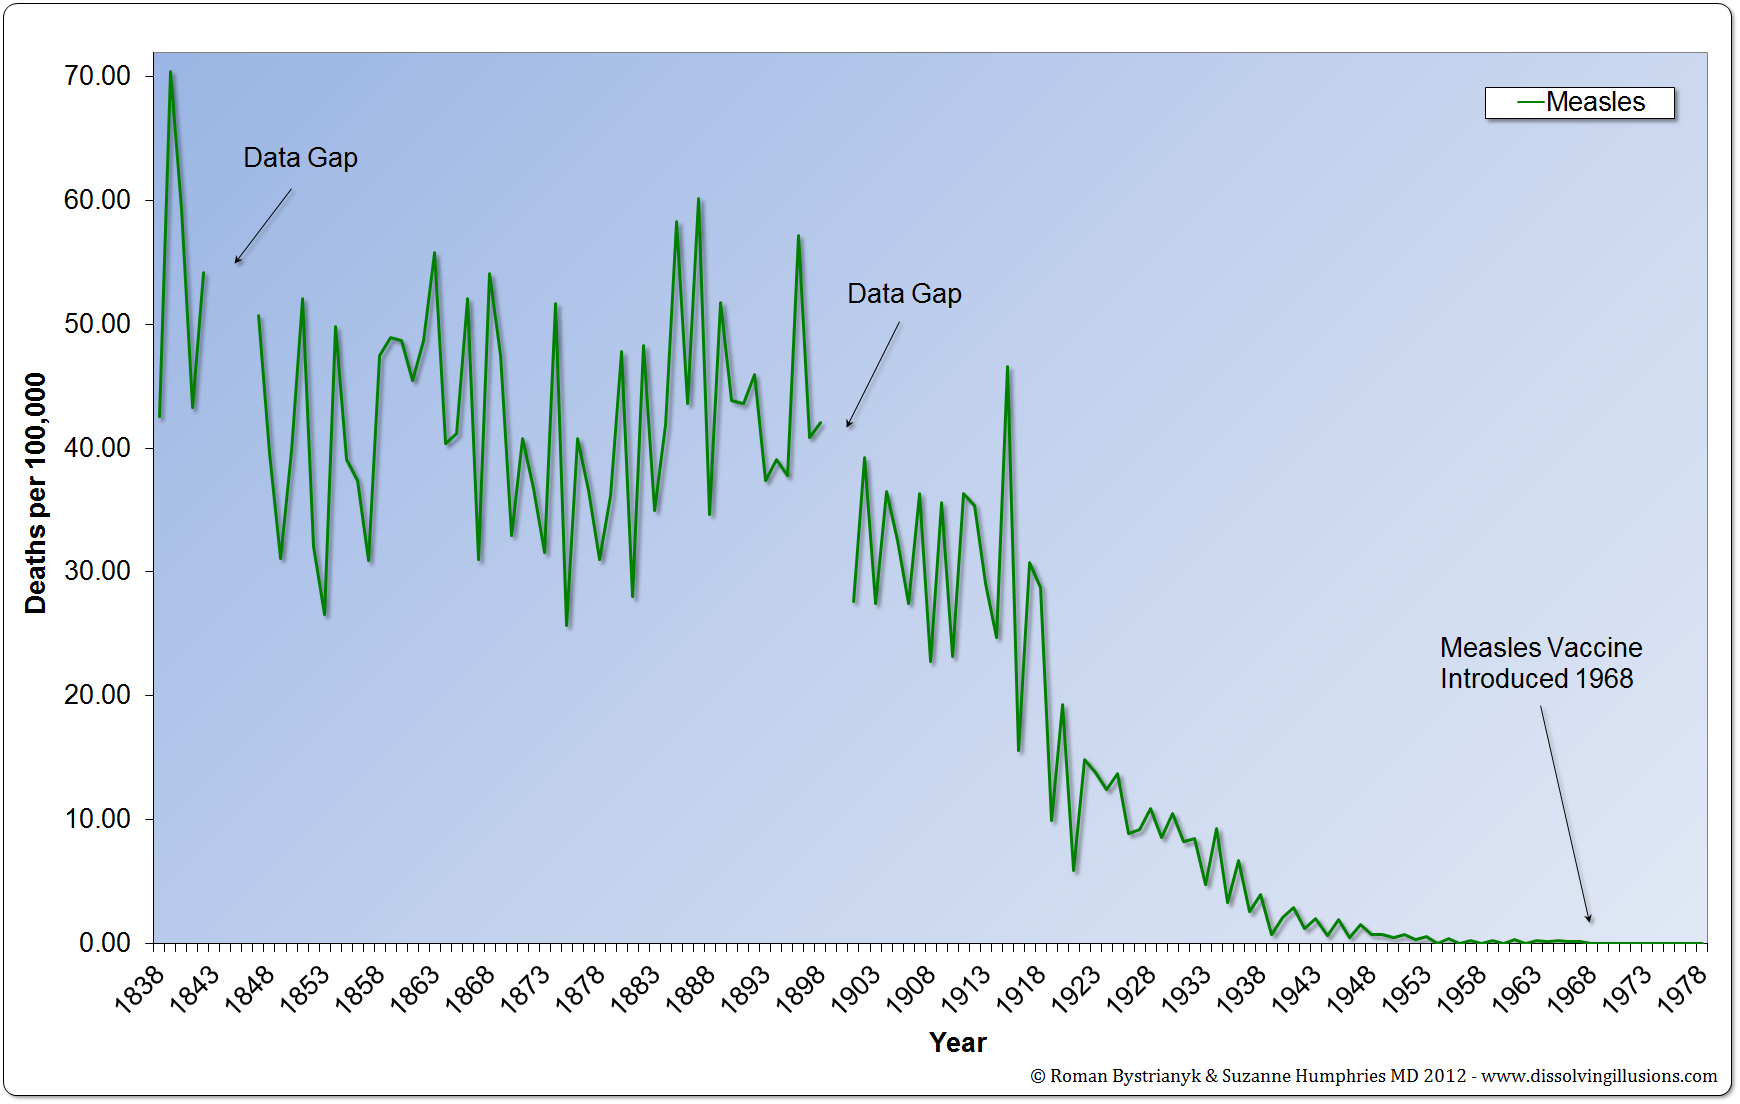
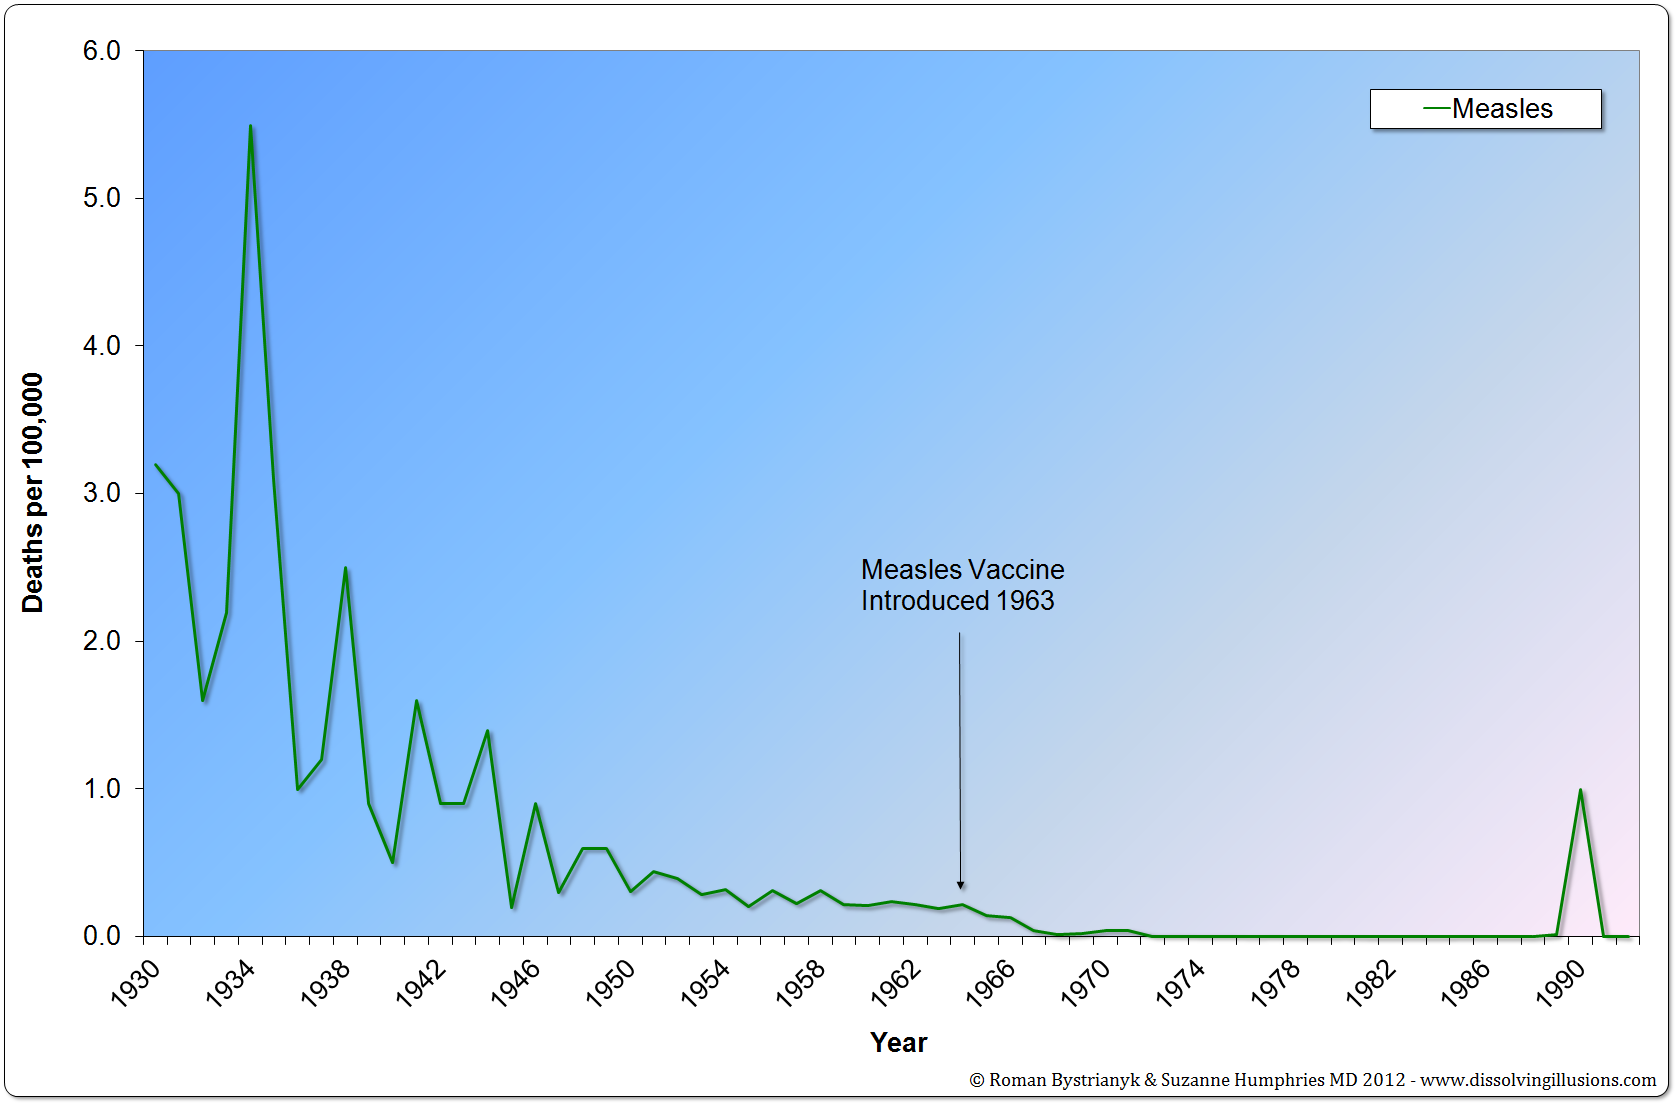
Graph 14.4: England and Wales measles mortality rate from 1838 to 1978. (Record of mortality in England and Wales for 95 years as provided by the Office of National Statistics, published 1997; Report to The Honourable Sir George Cornewall Lewis, Bart, MP, Her Majesty’s Principal Secretary of State for the Home Department, June 30, 1860, pp. a4, 205; Essay on Vaccination by Charles T. Pearce, MD, Member of the Royal College of Surgeons of England; Parliamentary Papers, the 62nd Annual Return of the Registrar General 1899 (1891–1898)) *First Edition: Graph 11.4
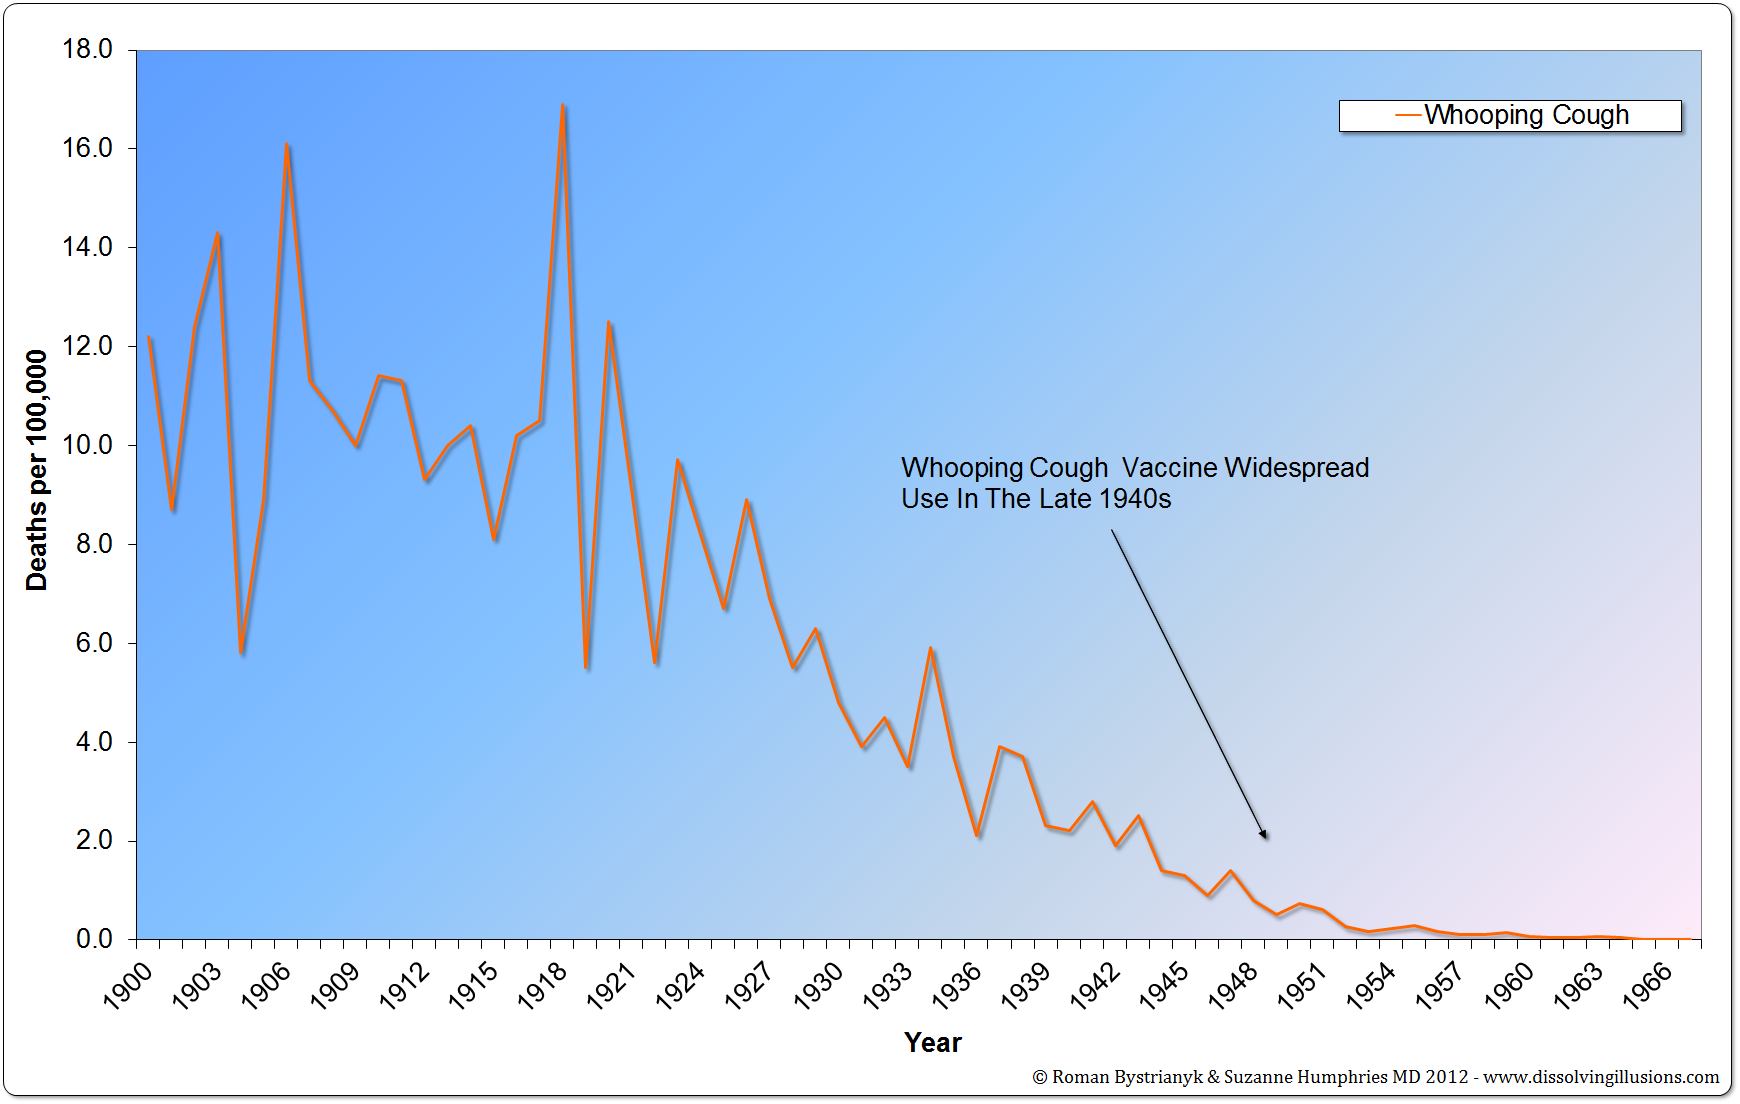
Graph 14.5: United States whooping cough mortality rate from 1900 to 1967. (Vital Statistics of the United States 1937, 1938, 1943, 1944, 1949, 1960, 1967, 1976, 1987, 1992; Historical Statistics of the United States—Colonial Times to 1970 Part 1; Health, United States, 2004, US Department of Health and Human Services; Vital Records & Health Data Development Section, Michigan Department of Community Health; US Census Bureau, Statistical Abstract of the United States: 2003; Reported Cases and Deaths from Vaccine Preventable Diseases, United States, 1950–2008) *First Edition: Graph 11.5
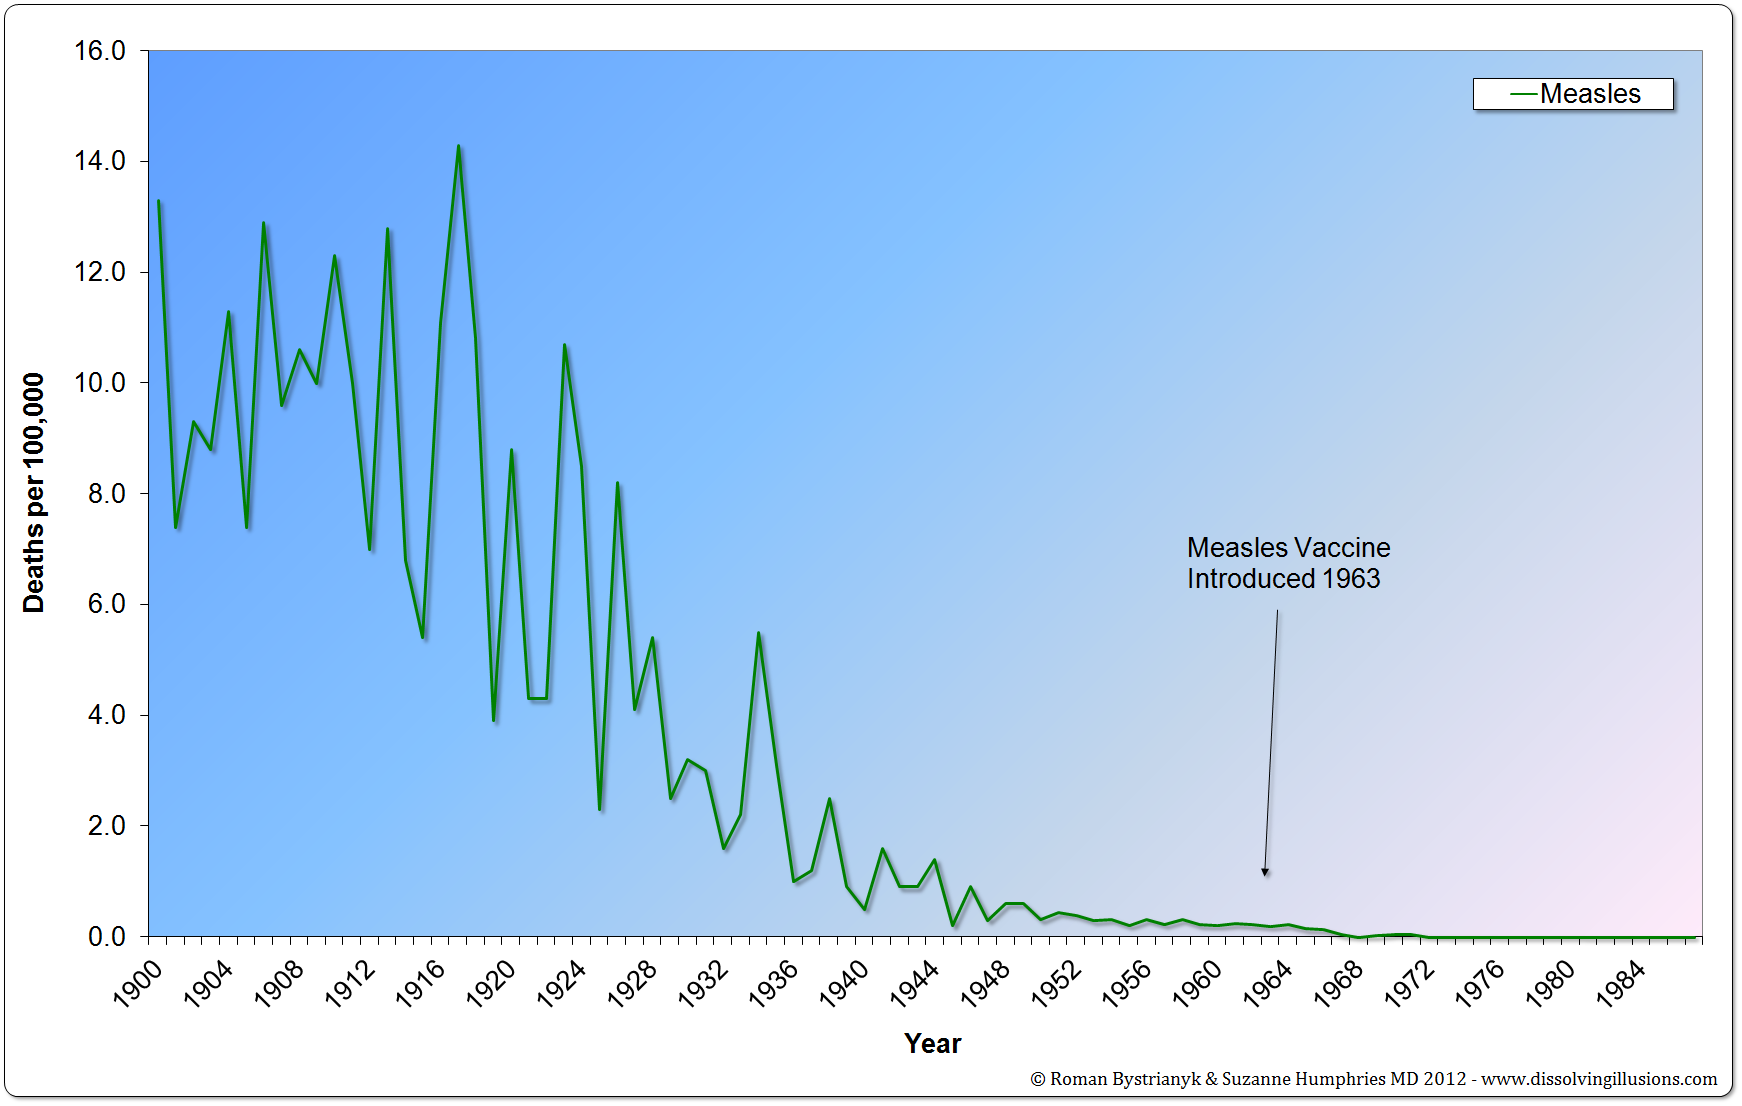
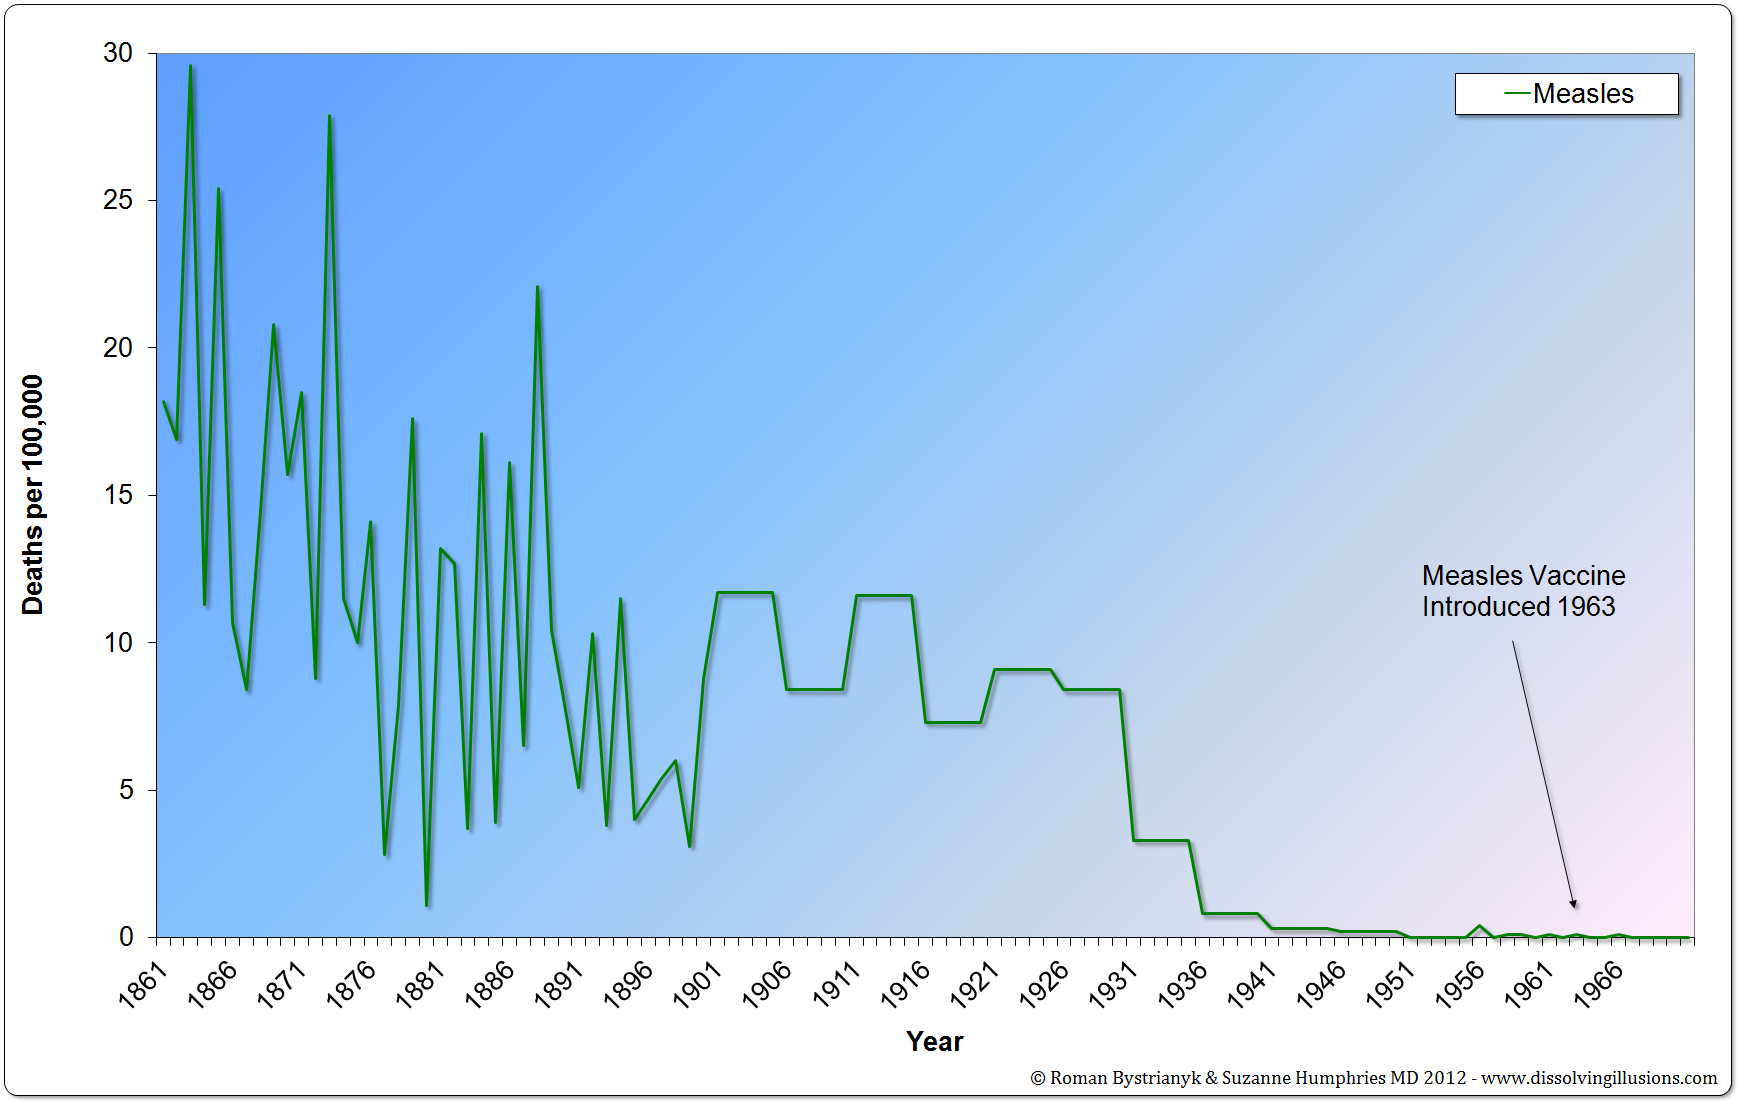
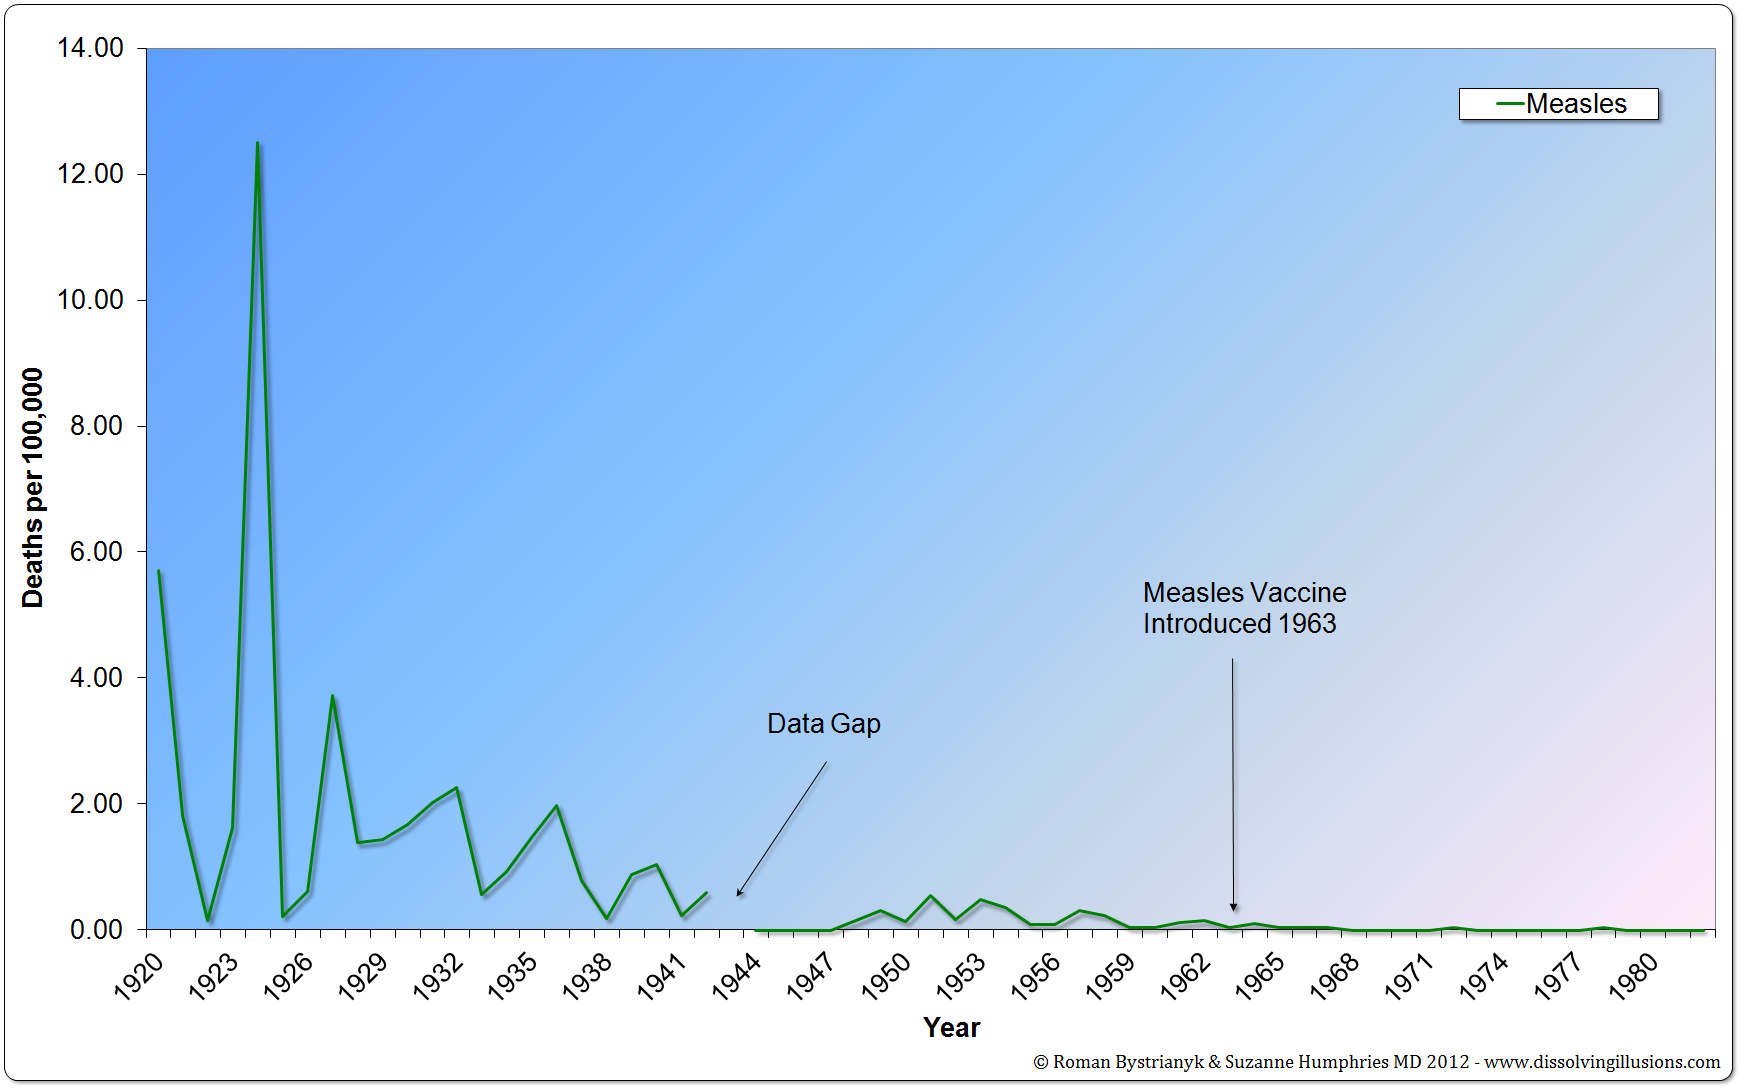
Graph 14.6: United States measles mortality rate from 1900 to 1987. (Vital Statistics of the United States 1937, 1938, 1943, 1944, 1949, 1960, 1967, 1976, 1987, 1992; Historical Statistics of the United States—Colonial Times to 1970 Part 1; Health, United States, 2004, US Department of Health and Human Services; Vital Records & Health Data Development Section, Michigan Department of Community Health; US Census Bureau, Statistical Abstract of the United States: 2003; Reported Cases and Deaths from Vaccine Preventable Diseases, United States, 1950–2008) *First Edition: Graph 11.6
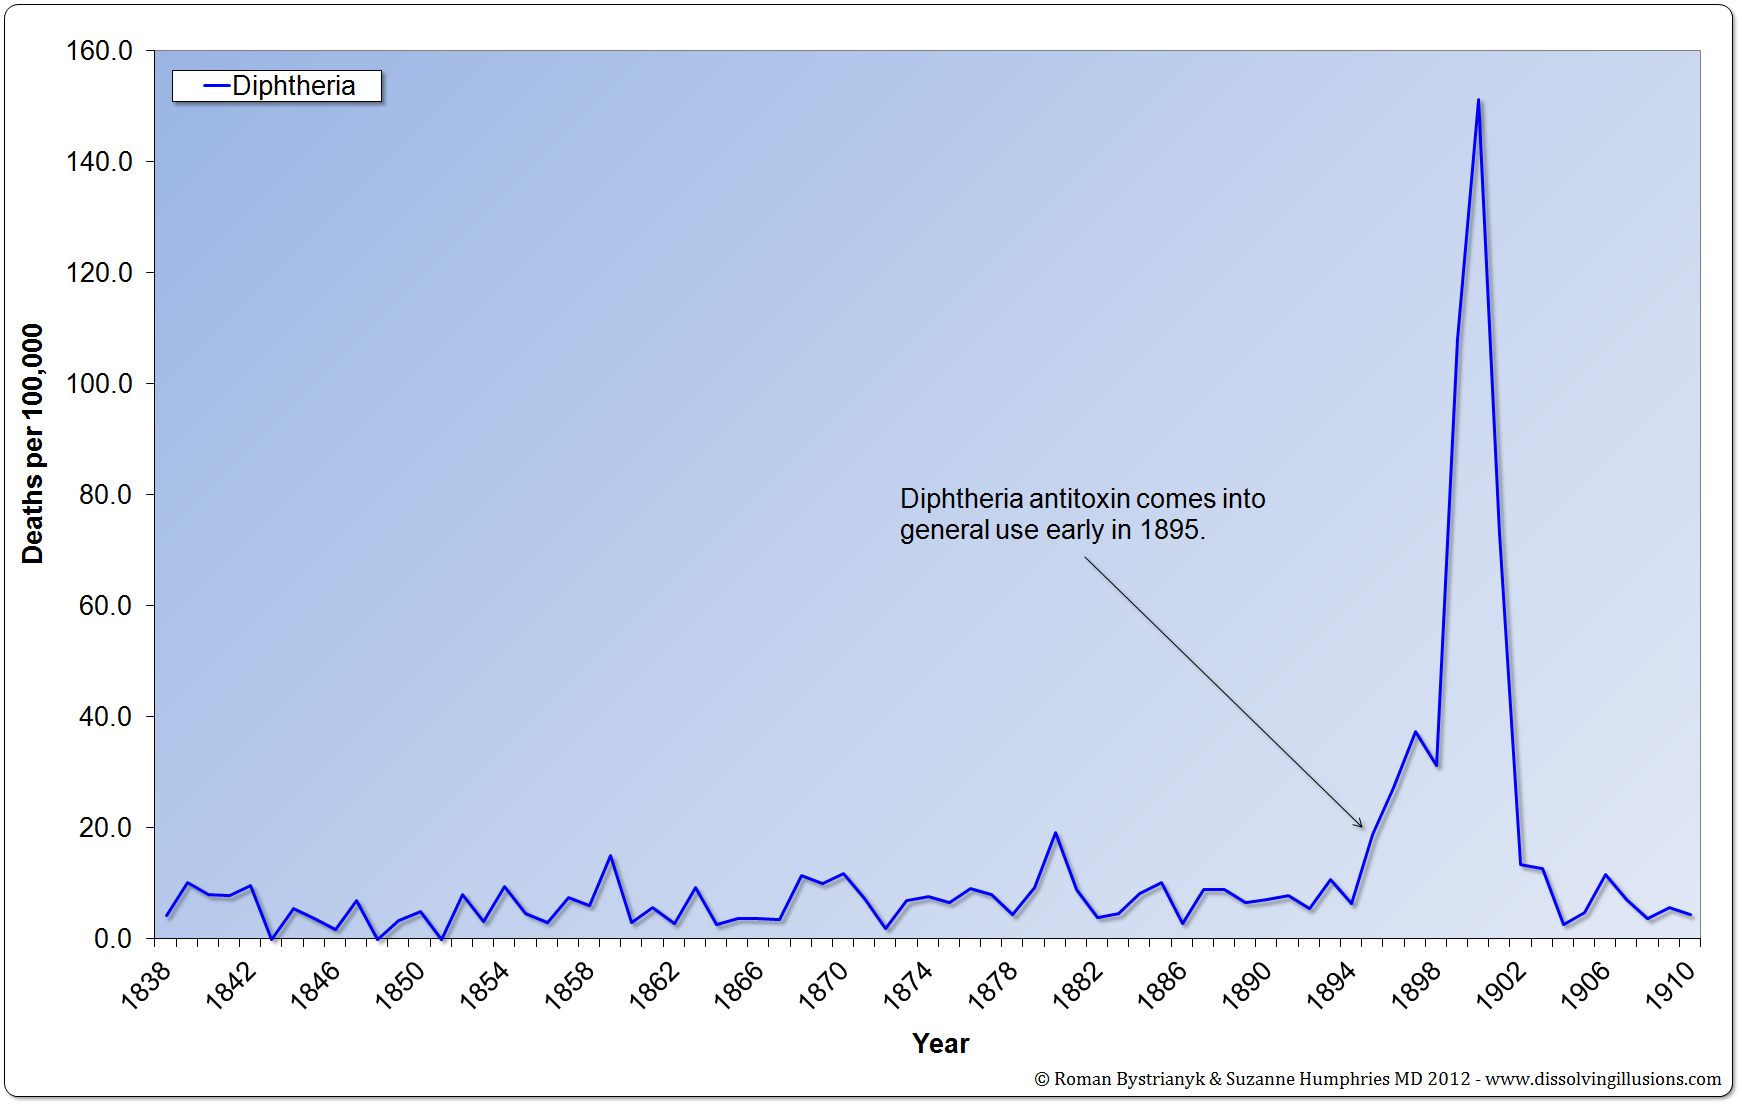
Graph 14.7: Leicester, England, diphtheria mortality rate from 1880 to 1910. (Vital Statistics of the United States 1937, 1938, 1943, 1944, 1949, 1960, 1967, 1976, 1987, 1992; Historical Statistics of the United States—Colonial Times to 1970 Part 1; Health, United States, 2004, US Department of Health and Human Services; Vital Records & Health Data Development Section, Michigan Department of Community Health; US Census Bureau, Statistical Abstract of the United States: 2003; Reported Cases and Deaths from Vaccine Preventable Diseases, United States, 1950–2008) *First Edition: Graph 11.7
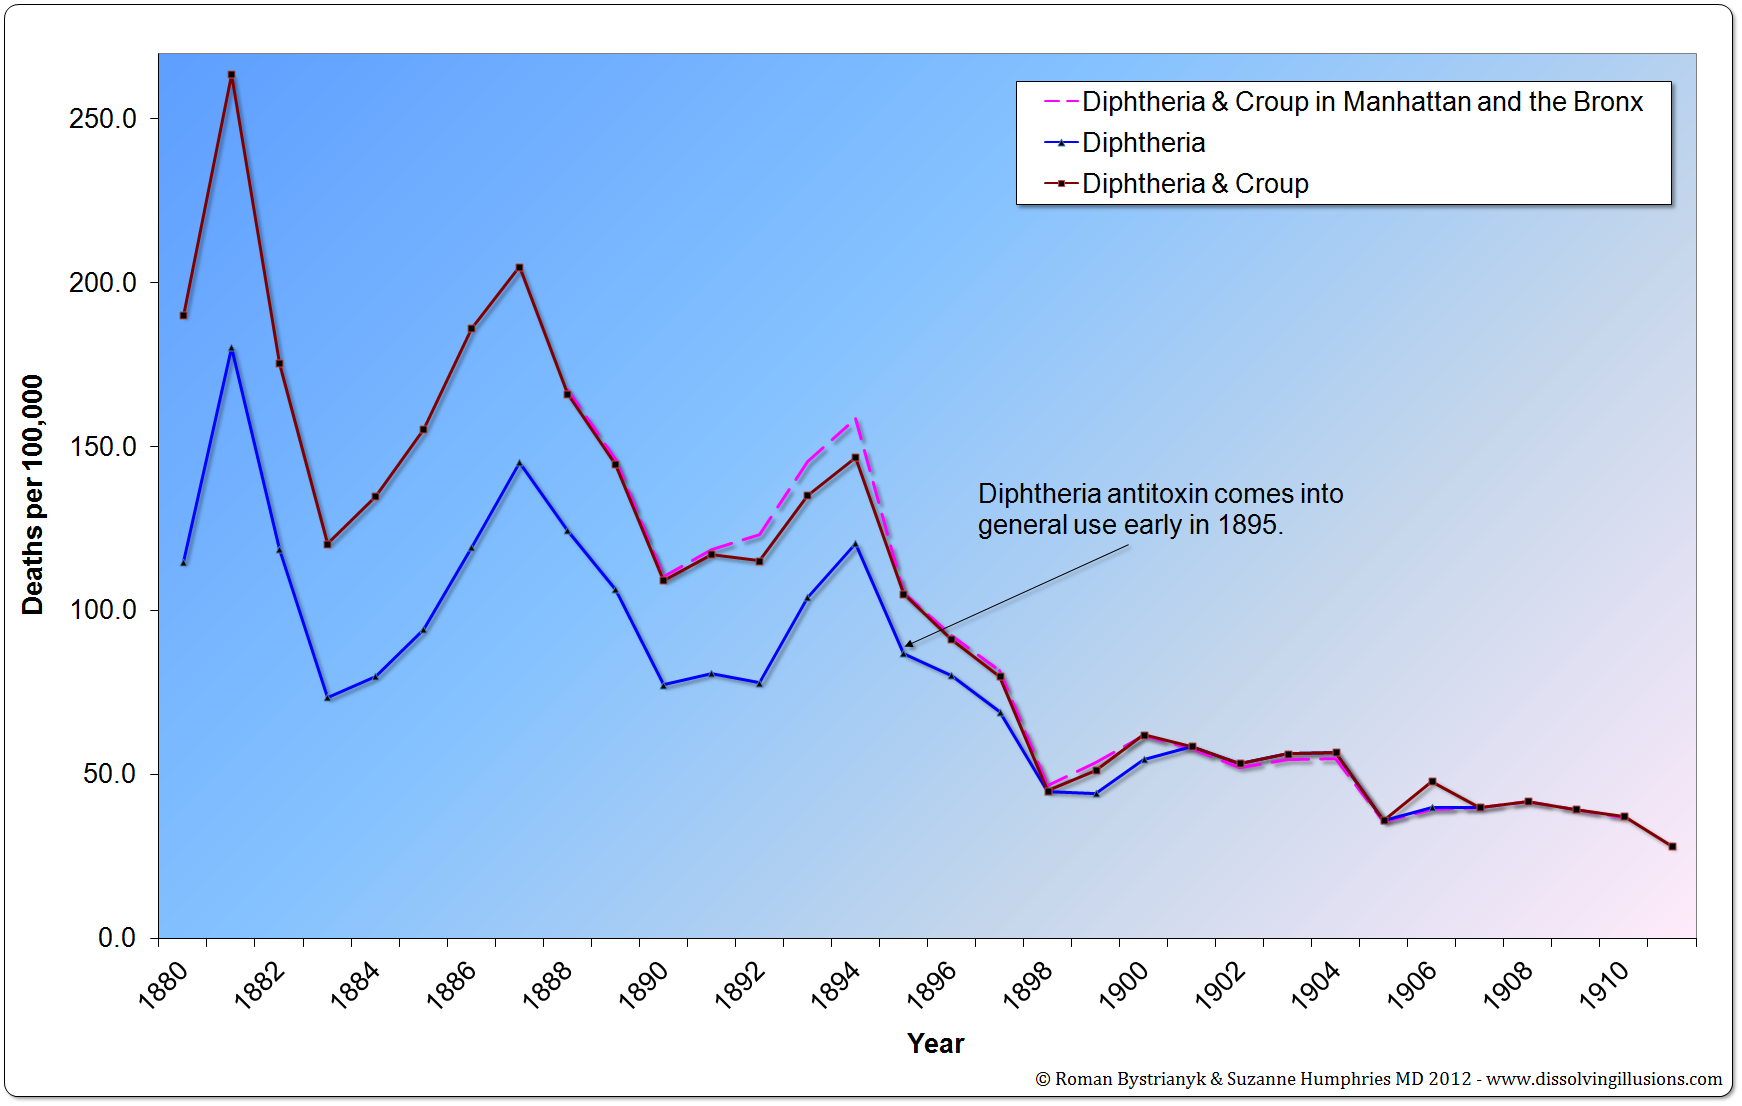
Graph 14.8: New York City diphtheria mortality rates from 1880 to 1911. (Twenty-Ninth Annual Report 1900 City of Boston, Boston—Municipal Printing Office, 1901, p. 7; Thirty-Sixth Annual Report of the Board of Health of the City of Boston for the Year 1907, Muncipal Printing Office 1908, p. 17; Annual Report of the Board of Health of the City of Boston for the Year 1911, Muncipal Printing Office, 1912, p. 243; Scientific Features of Modern Medicine, Frederic S. Lee, PhD, New York, Columbia University Press, 1911, p. 92) *First Edition: Graph 11.8
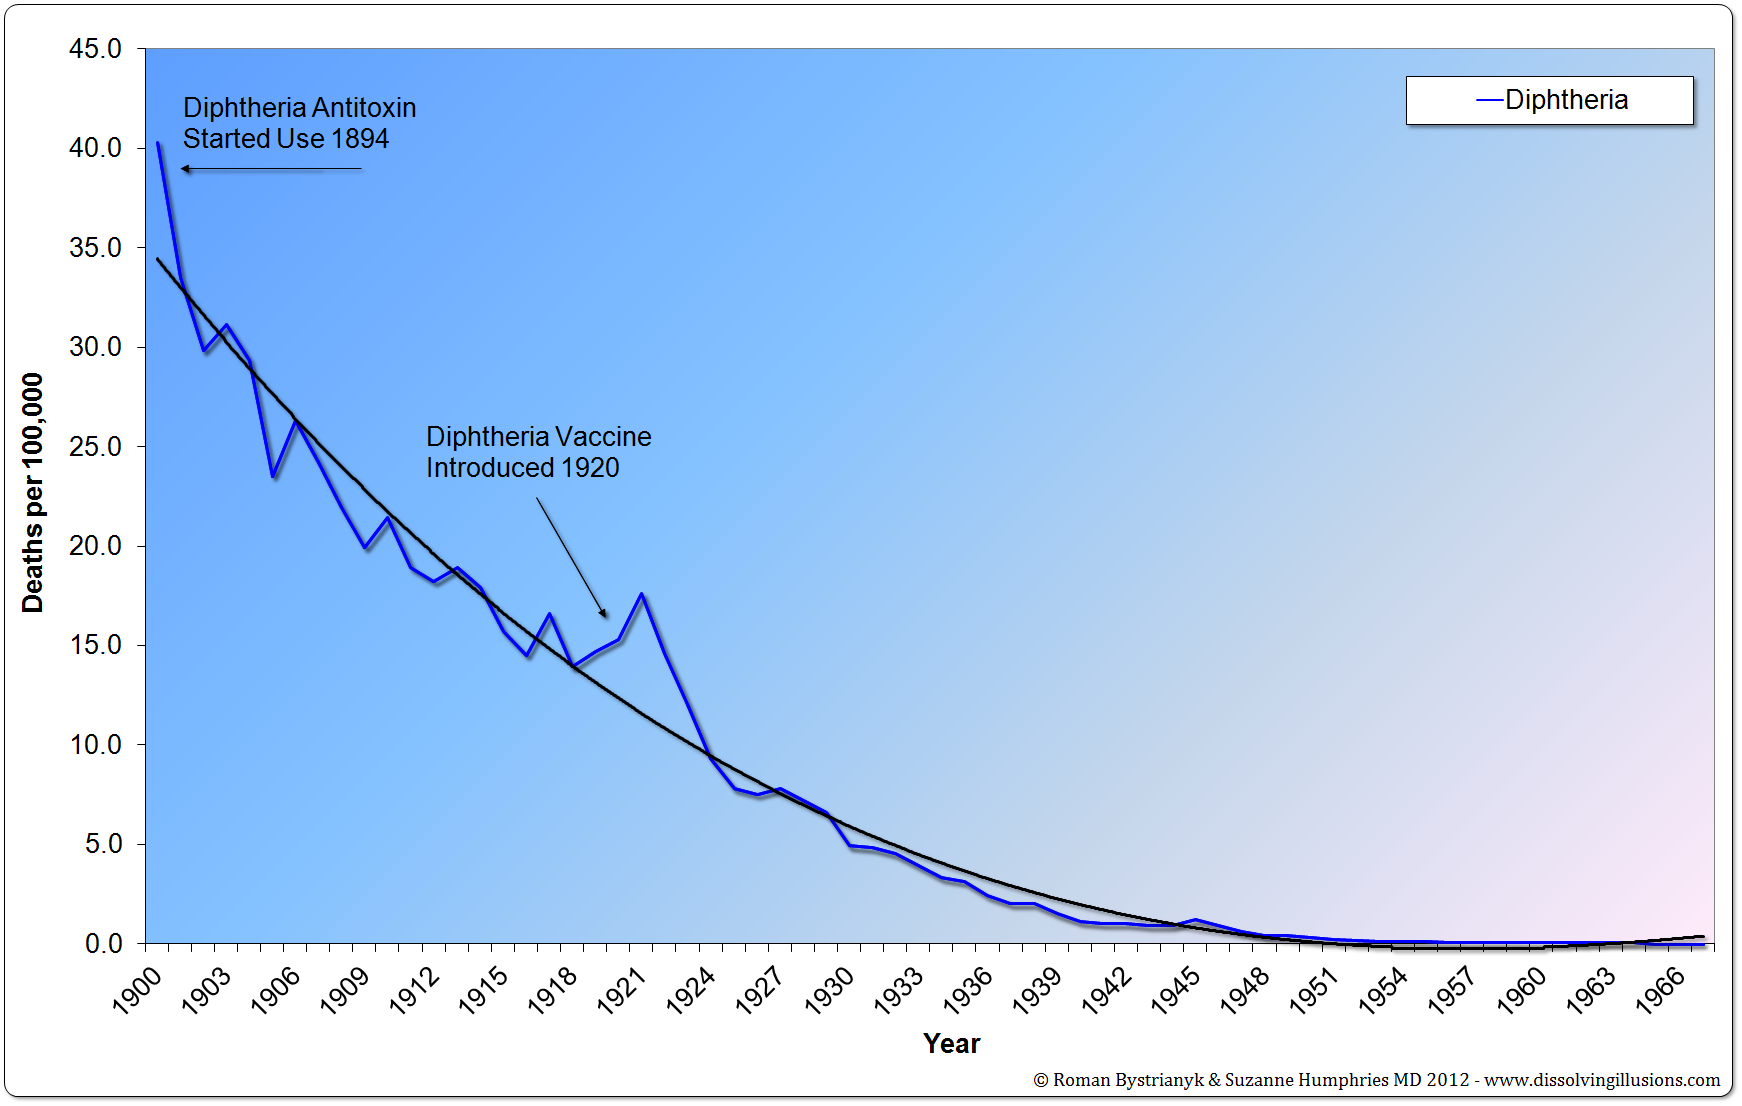
Graph 14.9: United States diphtheria mortality rate from 1900 to 1967. (Vital Statistics of the United States 1937, 1938, 1943, 1944, 1949, 1960, 1967, 1976, 1987, 1992; Historical Statistics of the United States— Colonial Times to 1970 Part 1; Health, United States, 2004, US Department of Health and Human Services; Vital Records & Health Data Development Section, Michigan Department of Community Health; US Census Bureau, Statistical Abstract of the United States: 2003; Reported Cases and Deaths from Vaccine Preventable Diseases, United States, 1950–2008) *First Edition: Graph 11.9
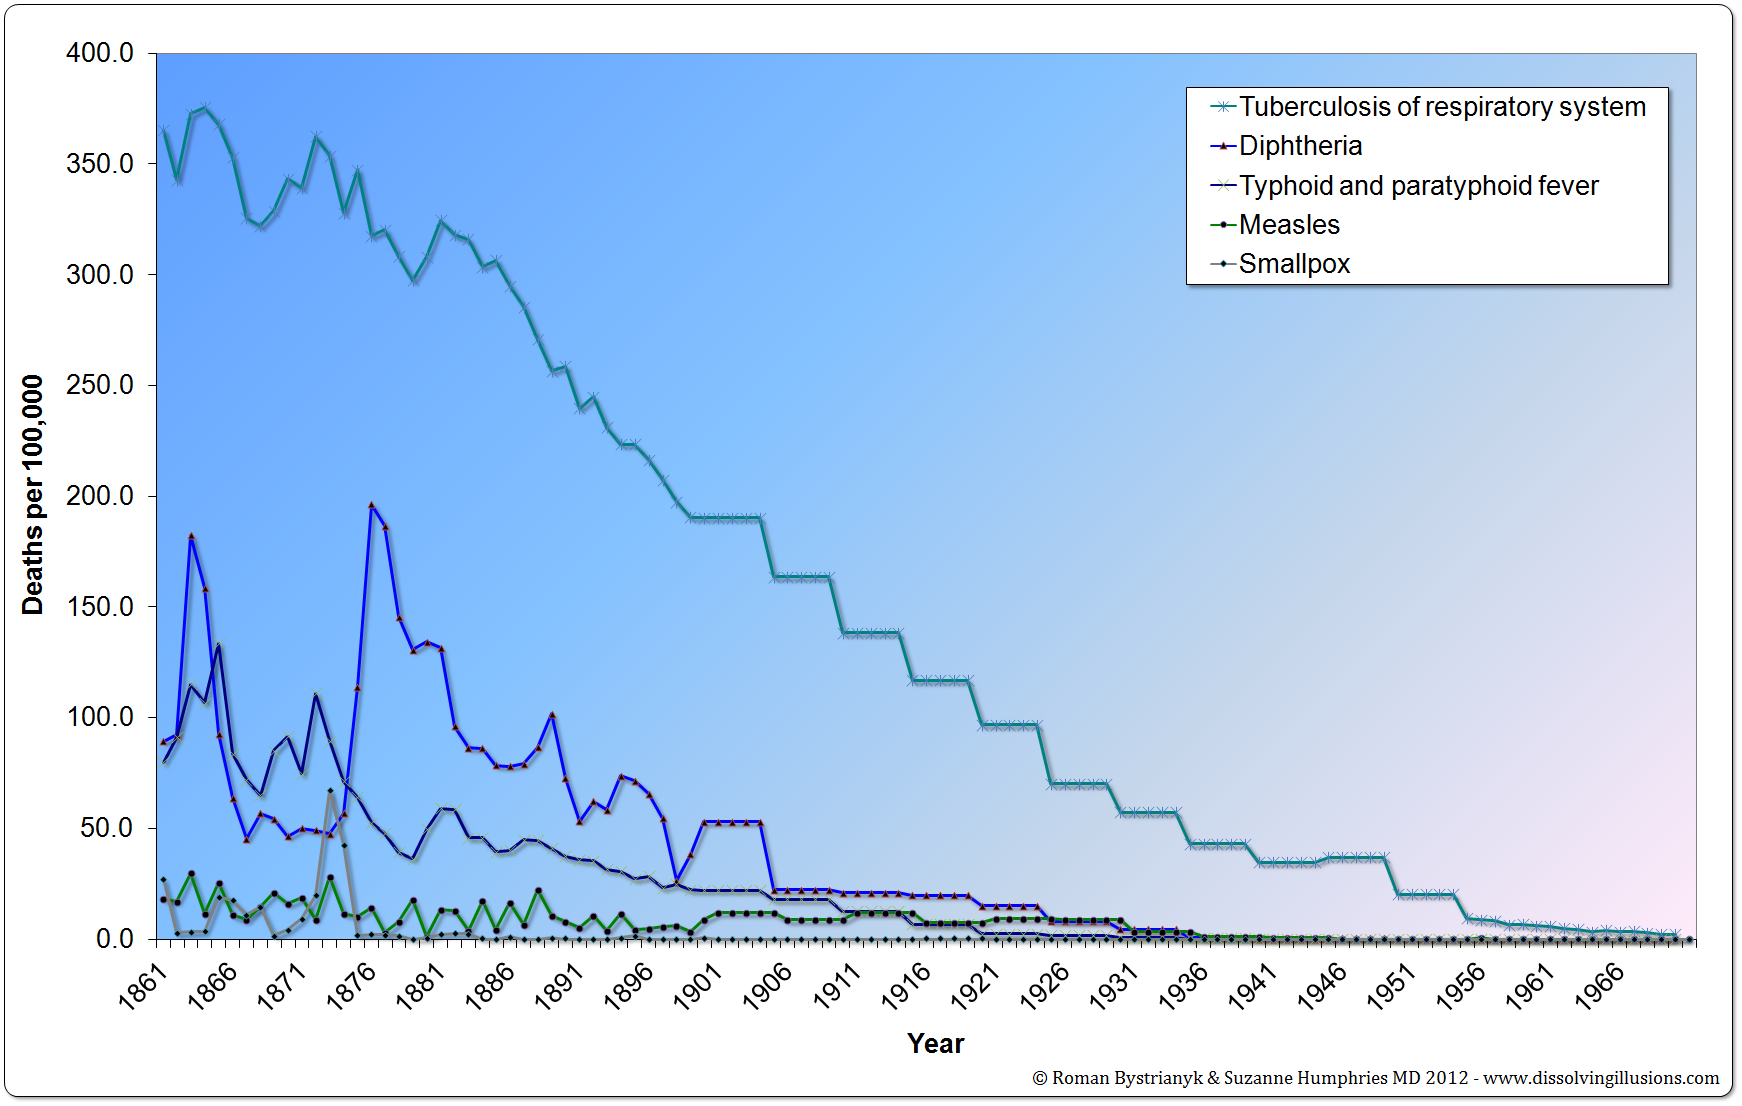
Graph 14.10: Massachusetts tuberculosis, diphtheria, typhoid, measles, and smallpox mortality rates from 1861 to 1970. (Historical Statistics of the United States—Colonial Times to 1970 Part 1, Bureau of the Census, p. 63) *First Edition: Graph 11.10
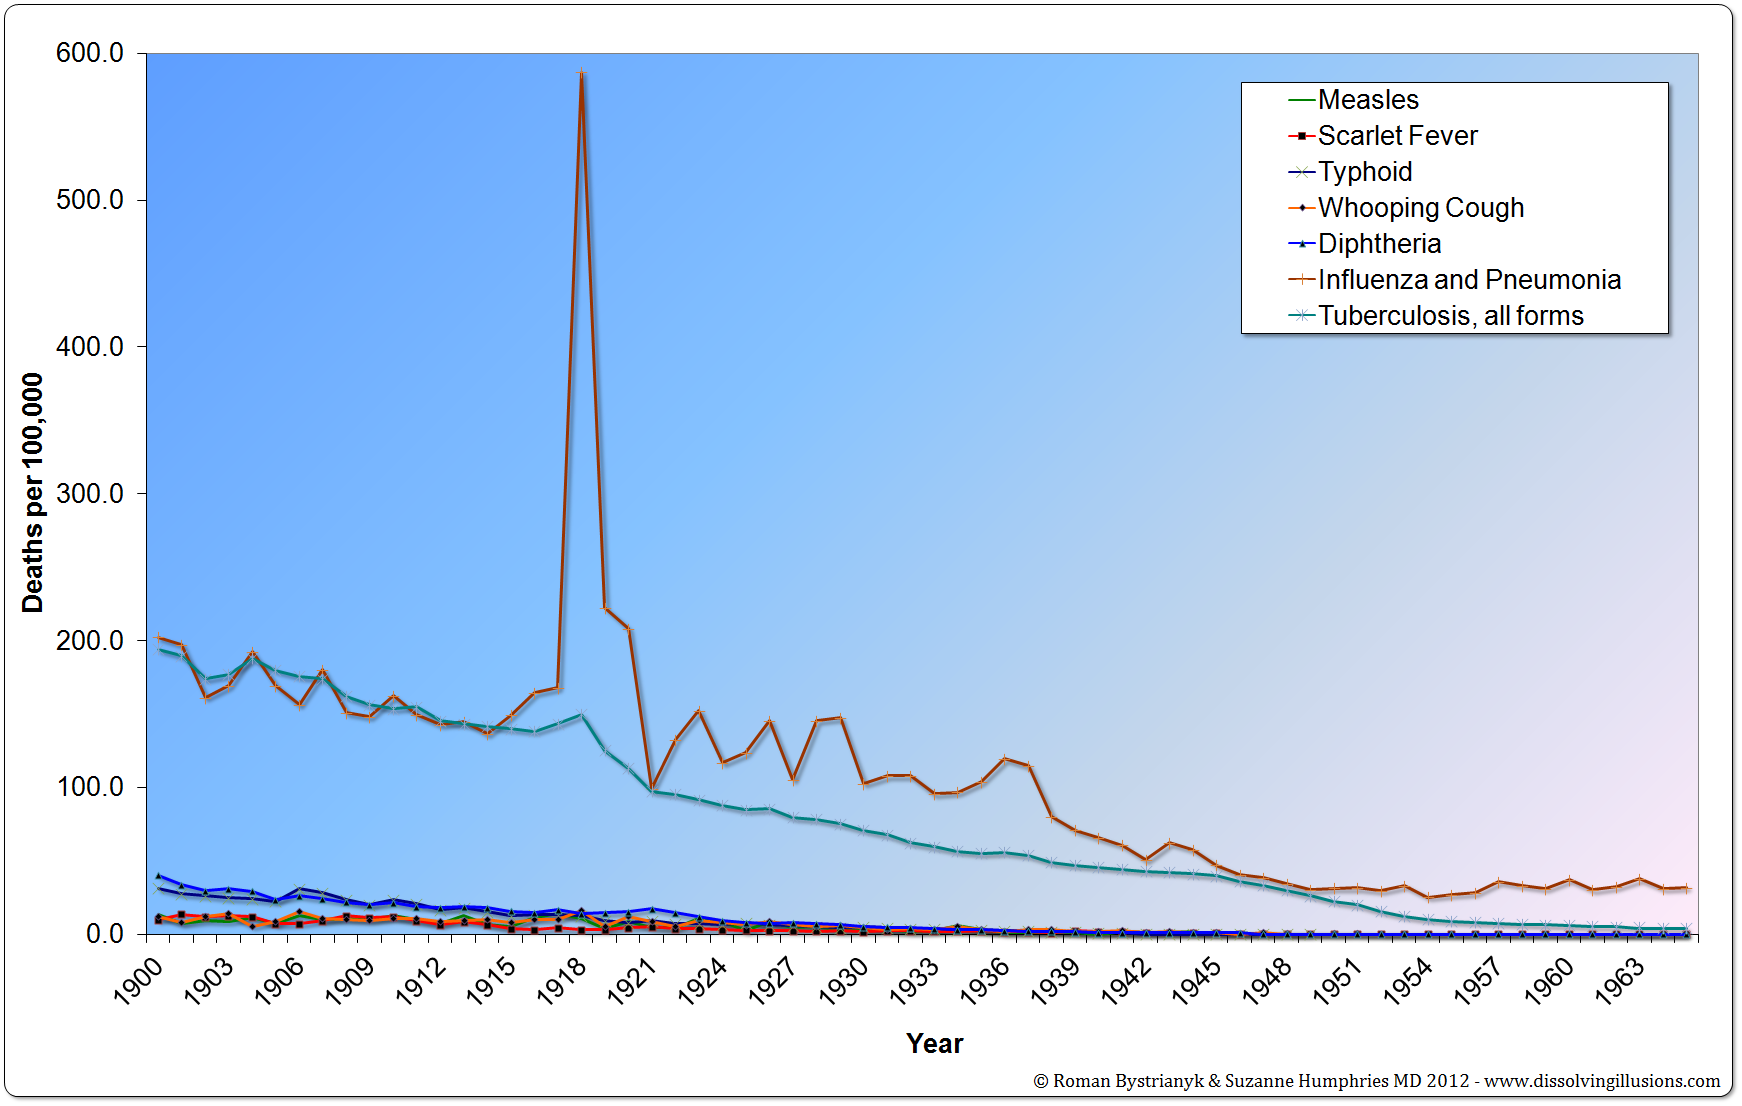
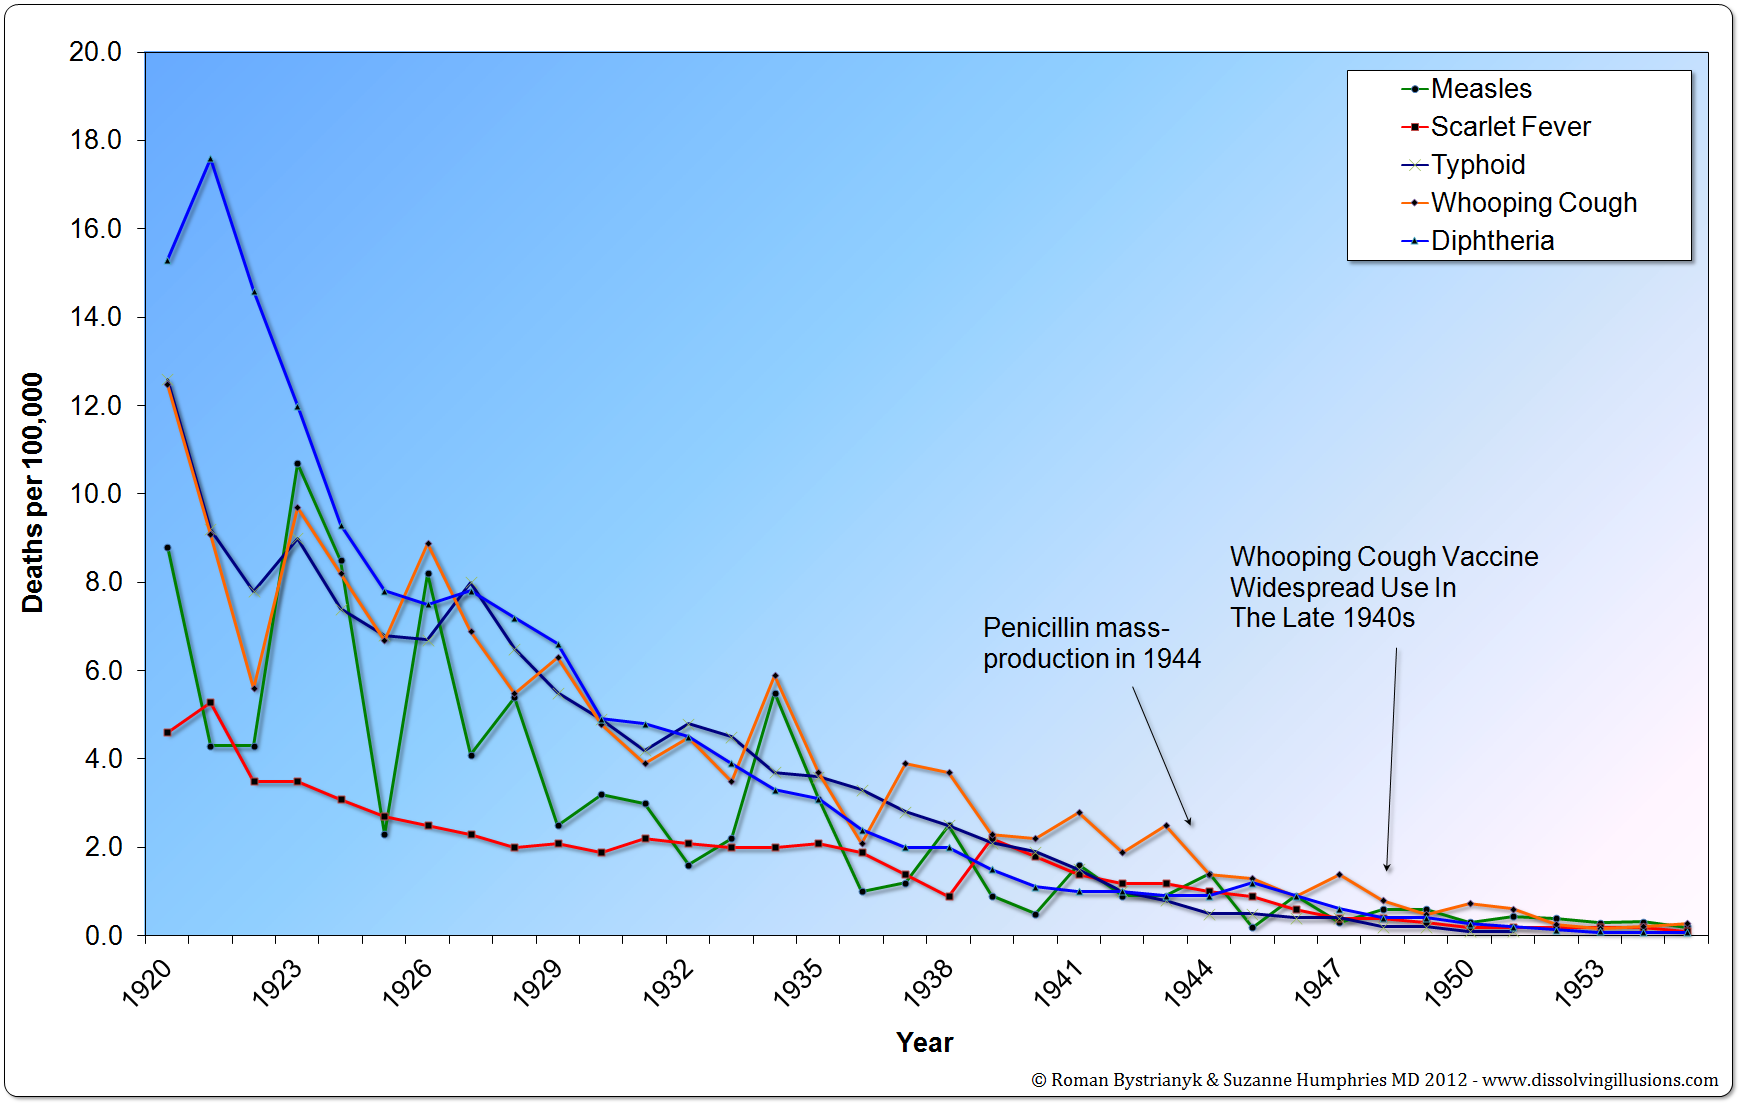
Graph 14.11: United States mortality rates from various infectious diseases from 1900 to 1965. (Vital Statistics of the United States 1937, 1938, 1943, 1944, 1949, 1960, 1967, 1976, 1987, 1992; Historical Statistics of the United States—Colonial Times to 1970 Part 1) *First Edition: Graph 11.11
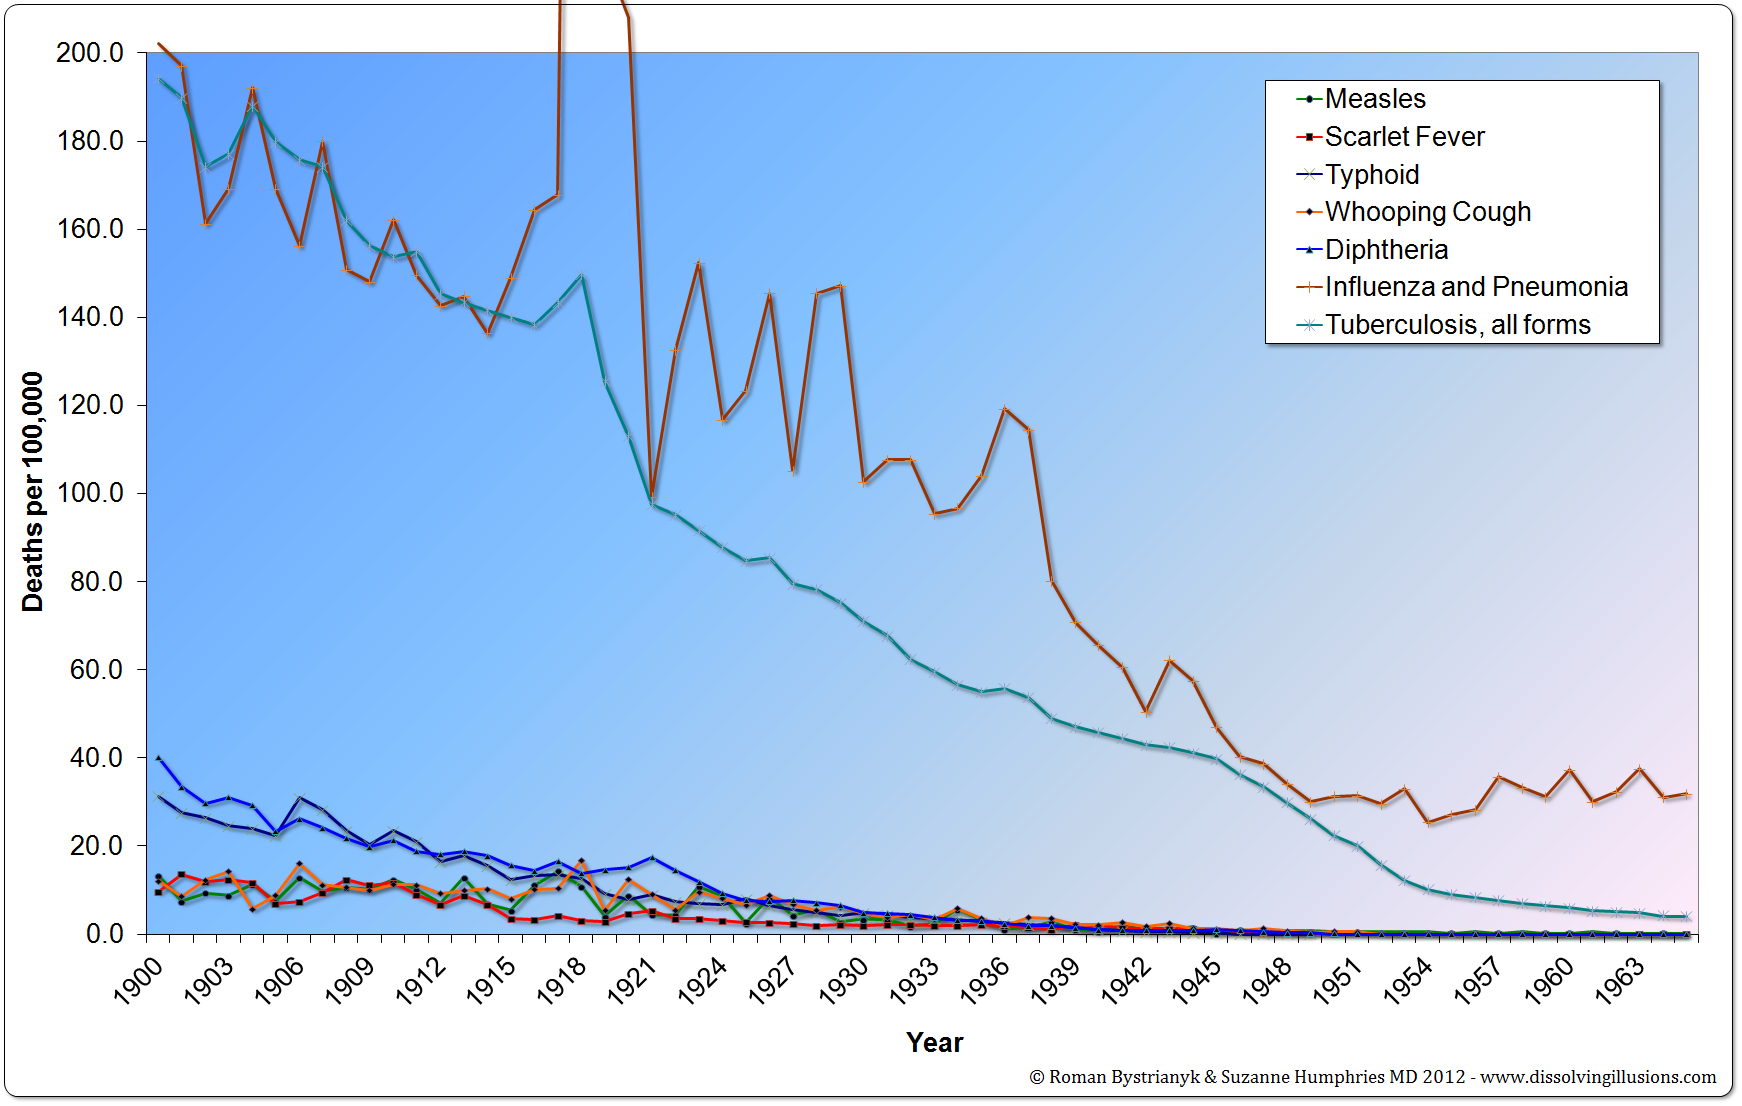
Graph 14.12: United States mortality rates from various infectious diseases from 1900 to 1965 magnified view. (Vital Statistics of the United States 1937, 1938, 1943, 1944, 1949, 1960, 1967, 1976, 1987, 1992; Historical Statistics of the United States—Colonial Times to 1970 Part 1) *First Edition: Graph 11.12
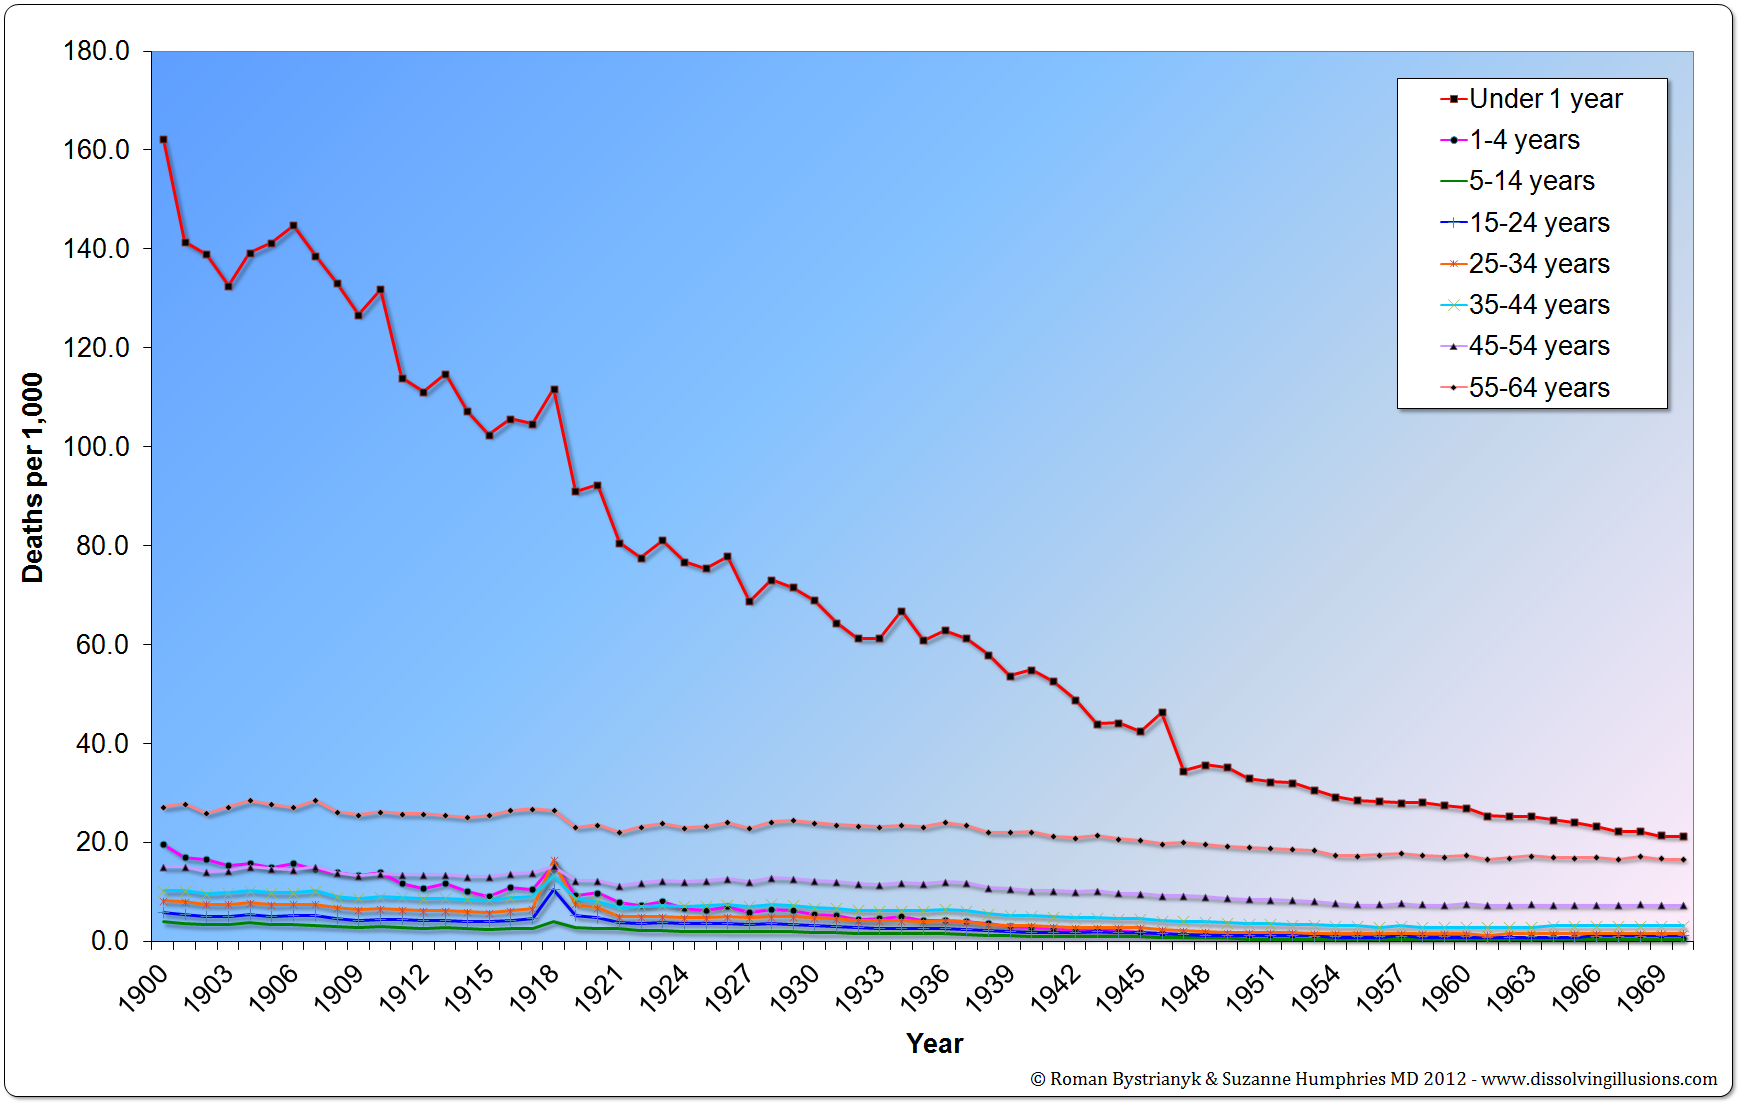
Graph 14.13: United States mortality rates for age groups from 1900 to 1970. (Historical Statistics of the United States—Colonial Times to 1970 Part 1, Bureau of the Census, p. 60) *First Edition: Graph 11.13
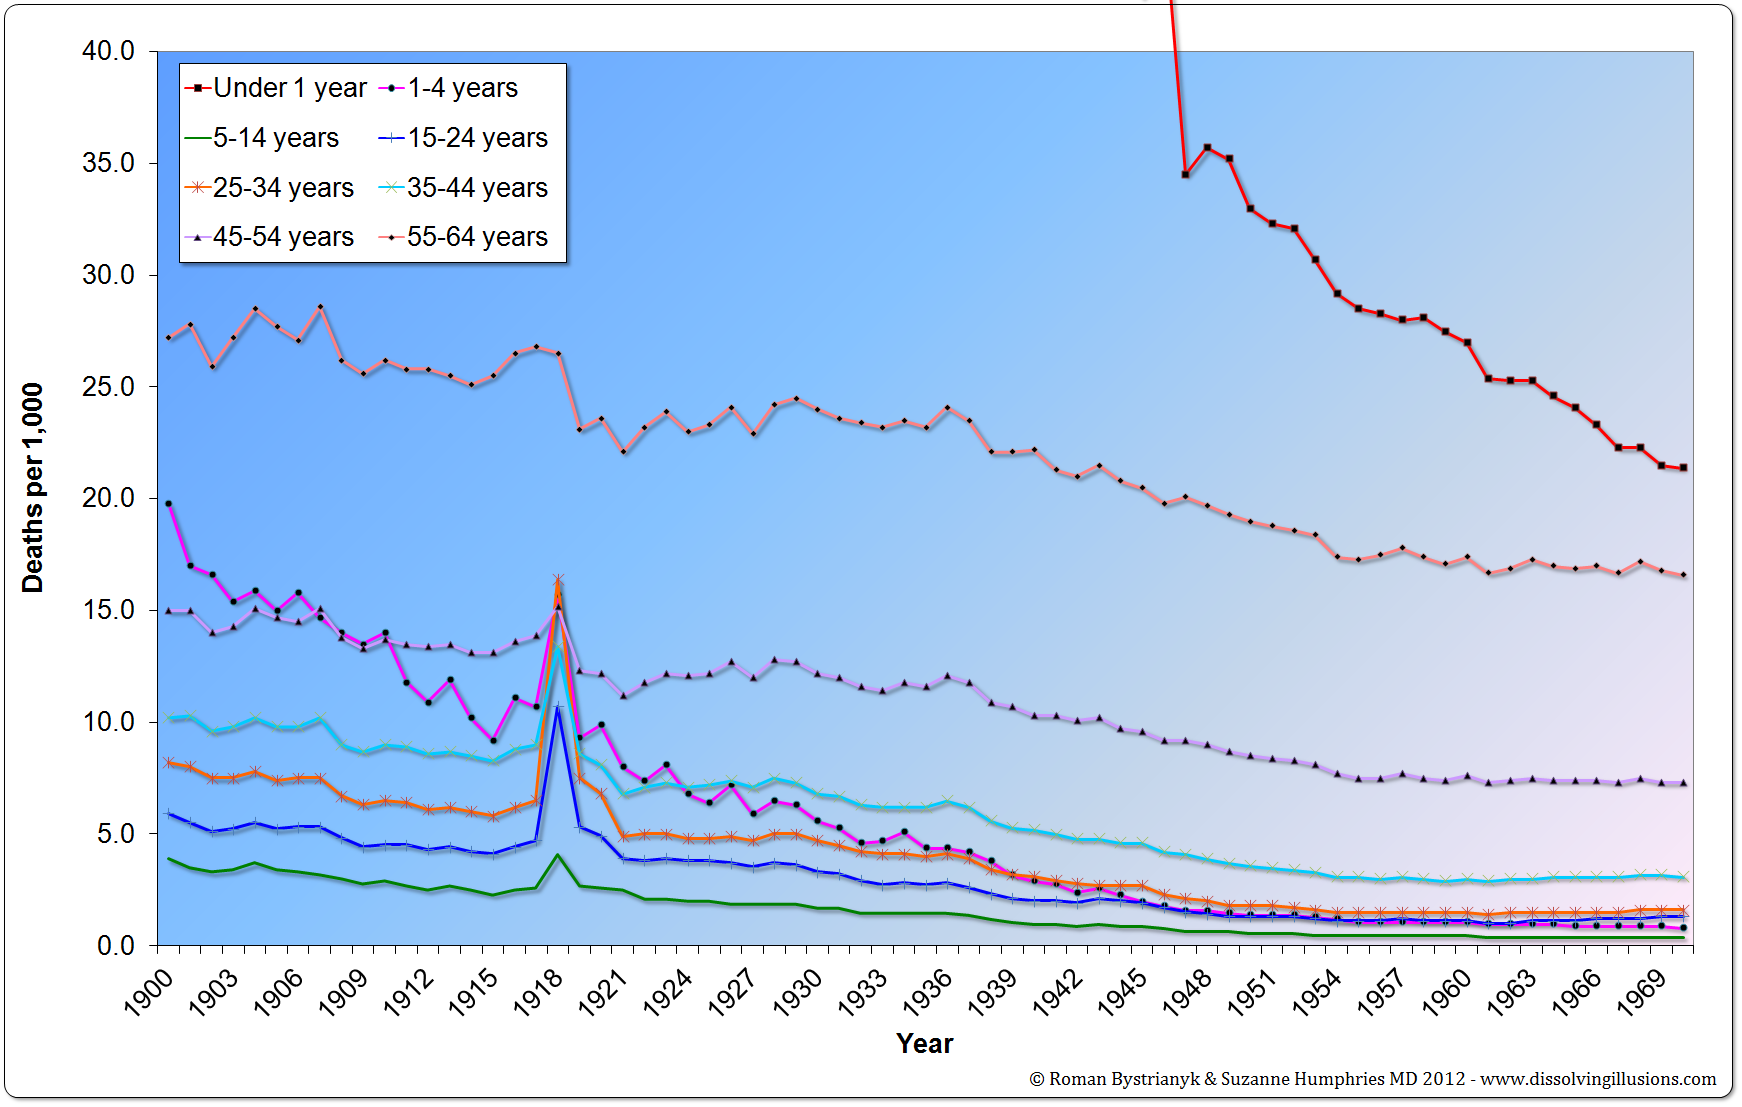
Graph 14.14: United States mortality rates for age groups from 1900 to 1970 magnified view. (Historical Statistics of the United States—Colonial Times to 1970 Part 1, Bureau of the Census, p. 60) *First Edition: Graph 11.14
Graph 15.1: United States disease incidence from 1912 to 1970. (Historical Statistics of the United States Colonial Times to 1970 Part 1, Bureau of the Census, 1975, pp. 77) *First Edition: Graph 12.1
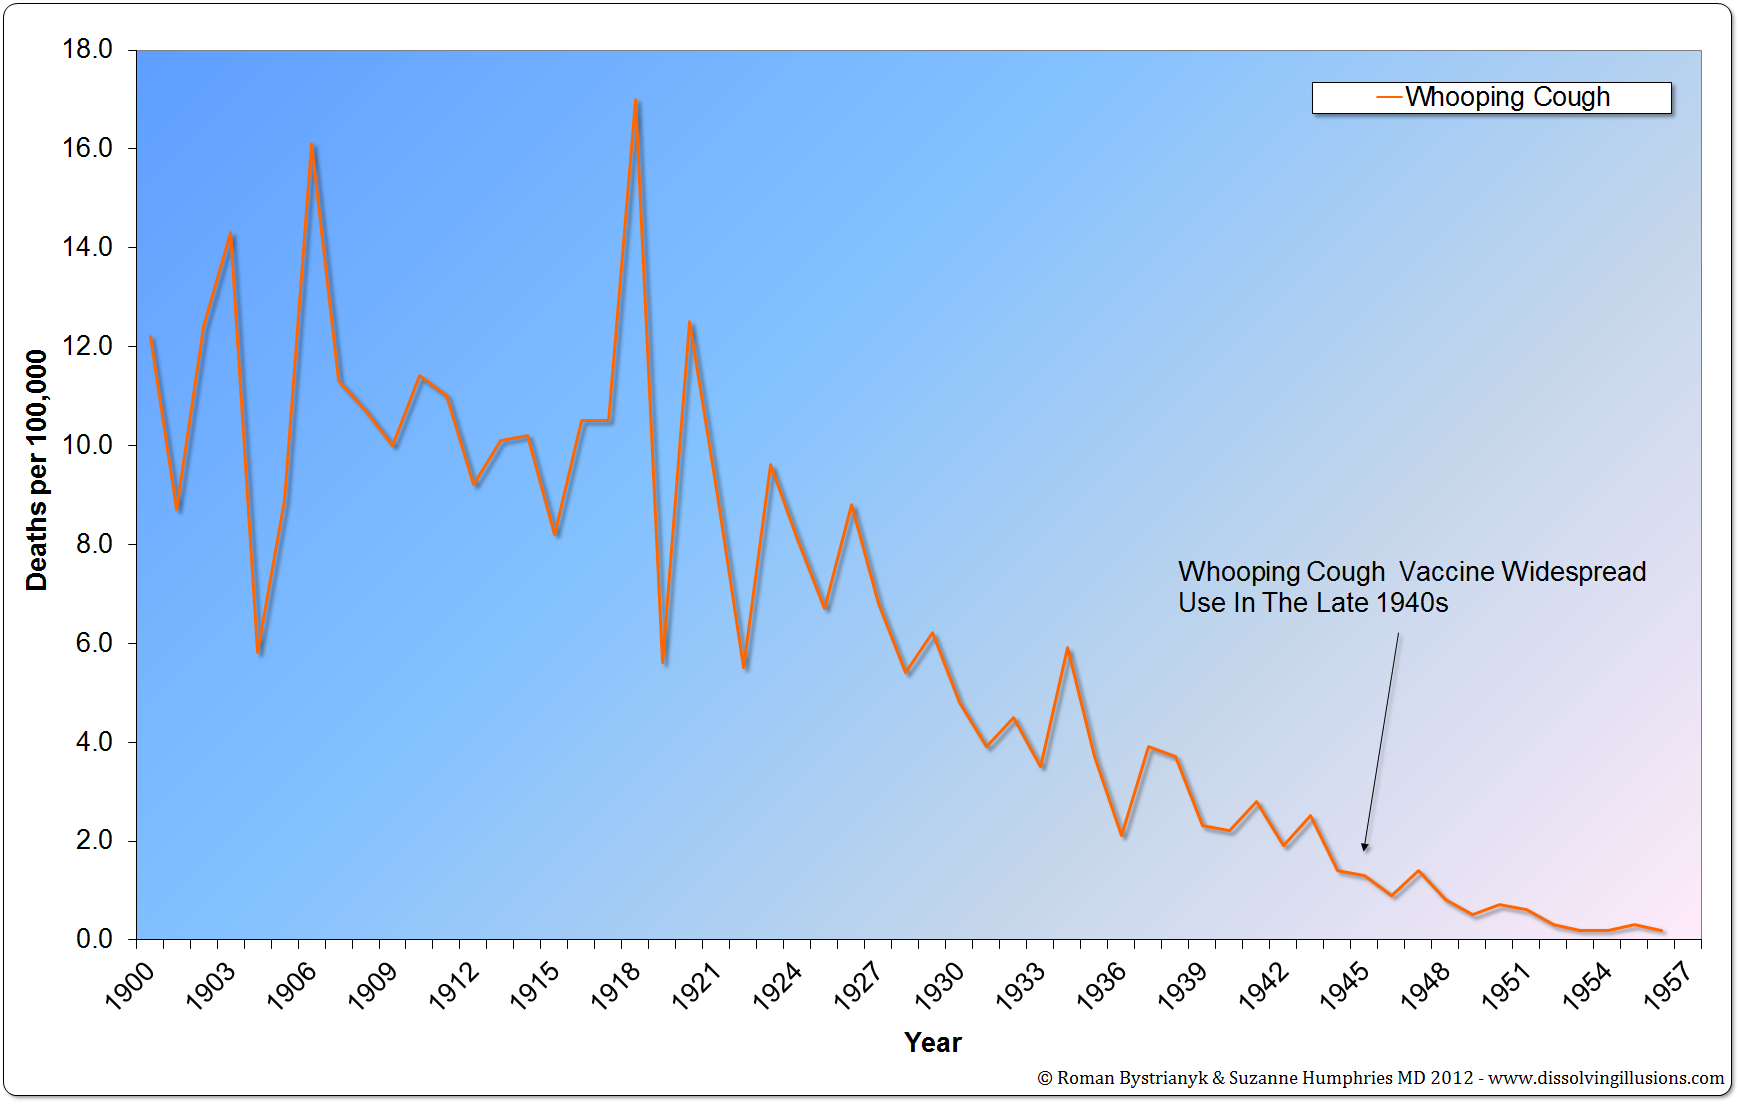
Graph 16.1: United States whooping cough mortality rate from 1900 to 1957. (Historical Statistics of the United States—Colonial Times to 1957, pp. 8, 26, 27) *First Edition: Graph 13.1
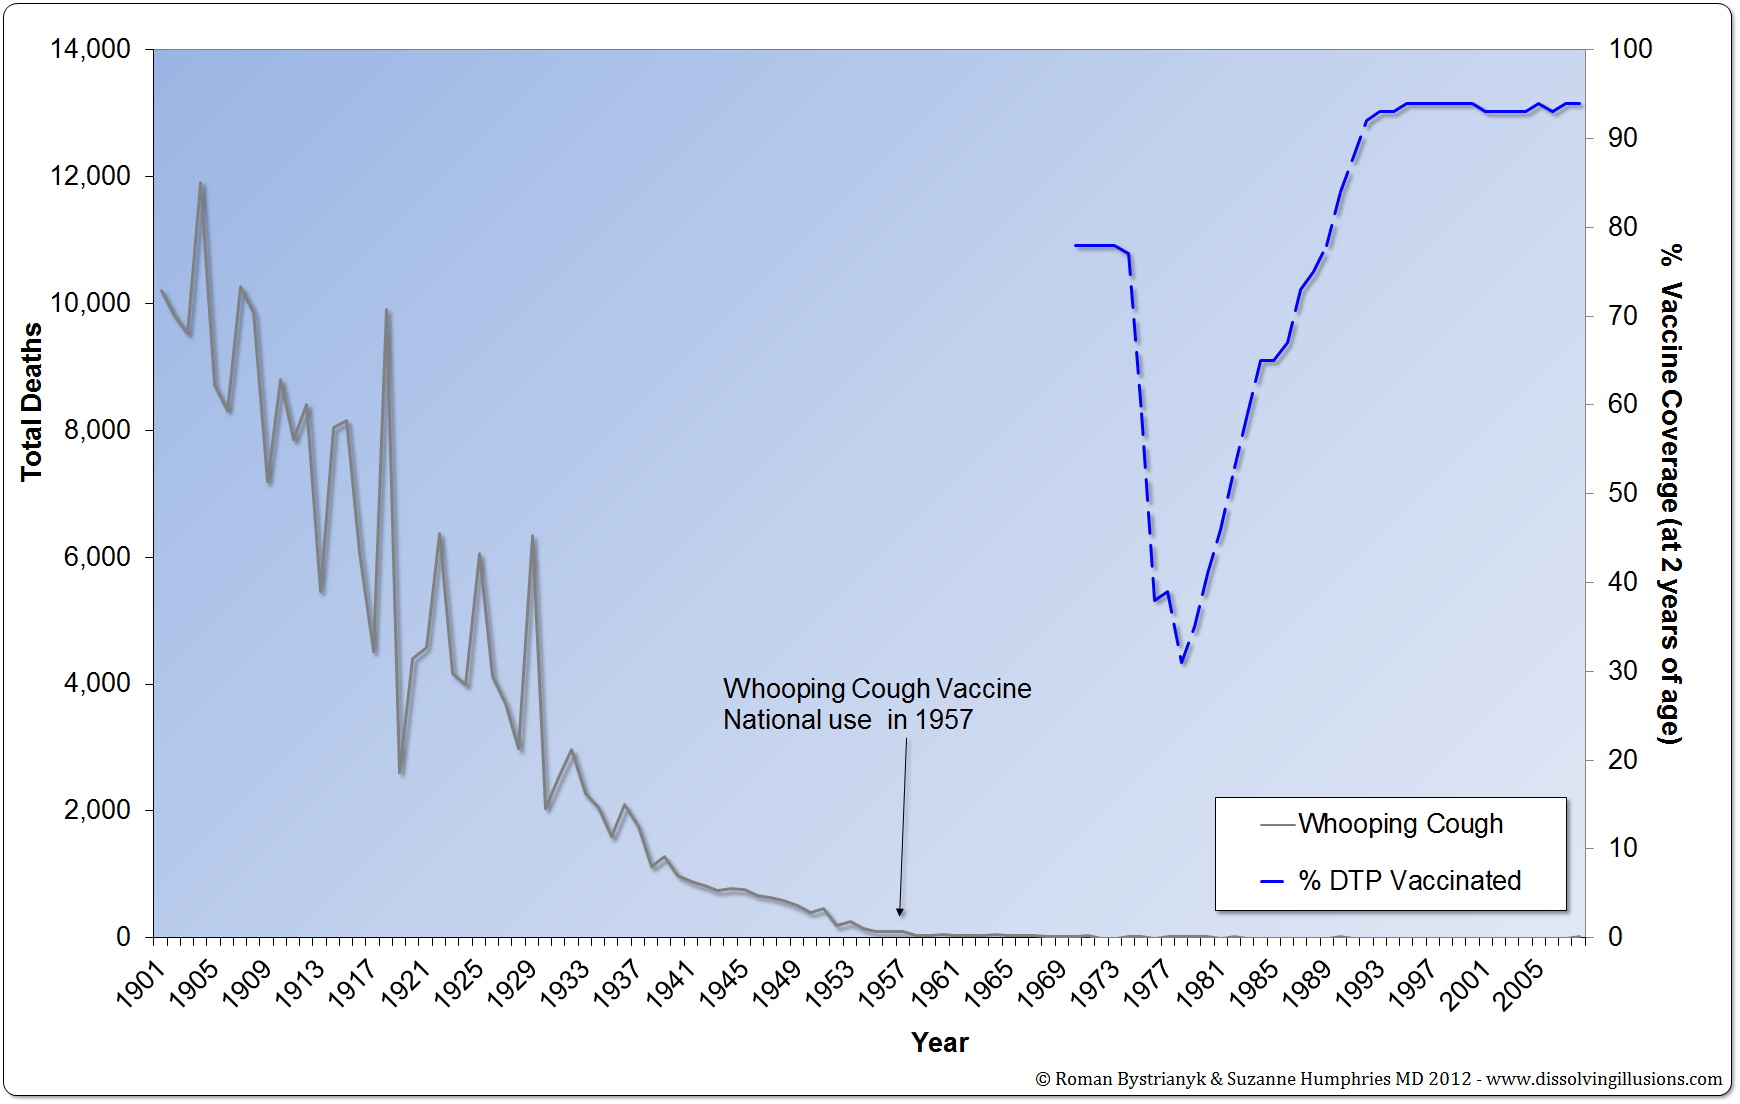
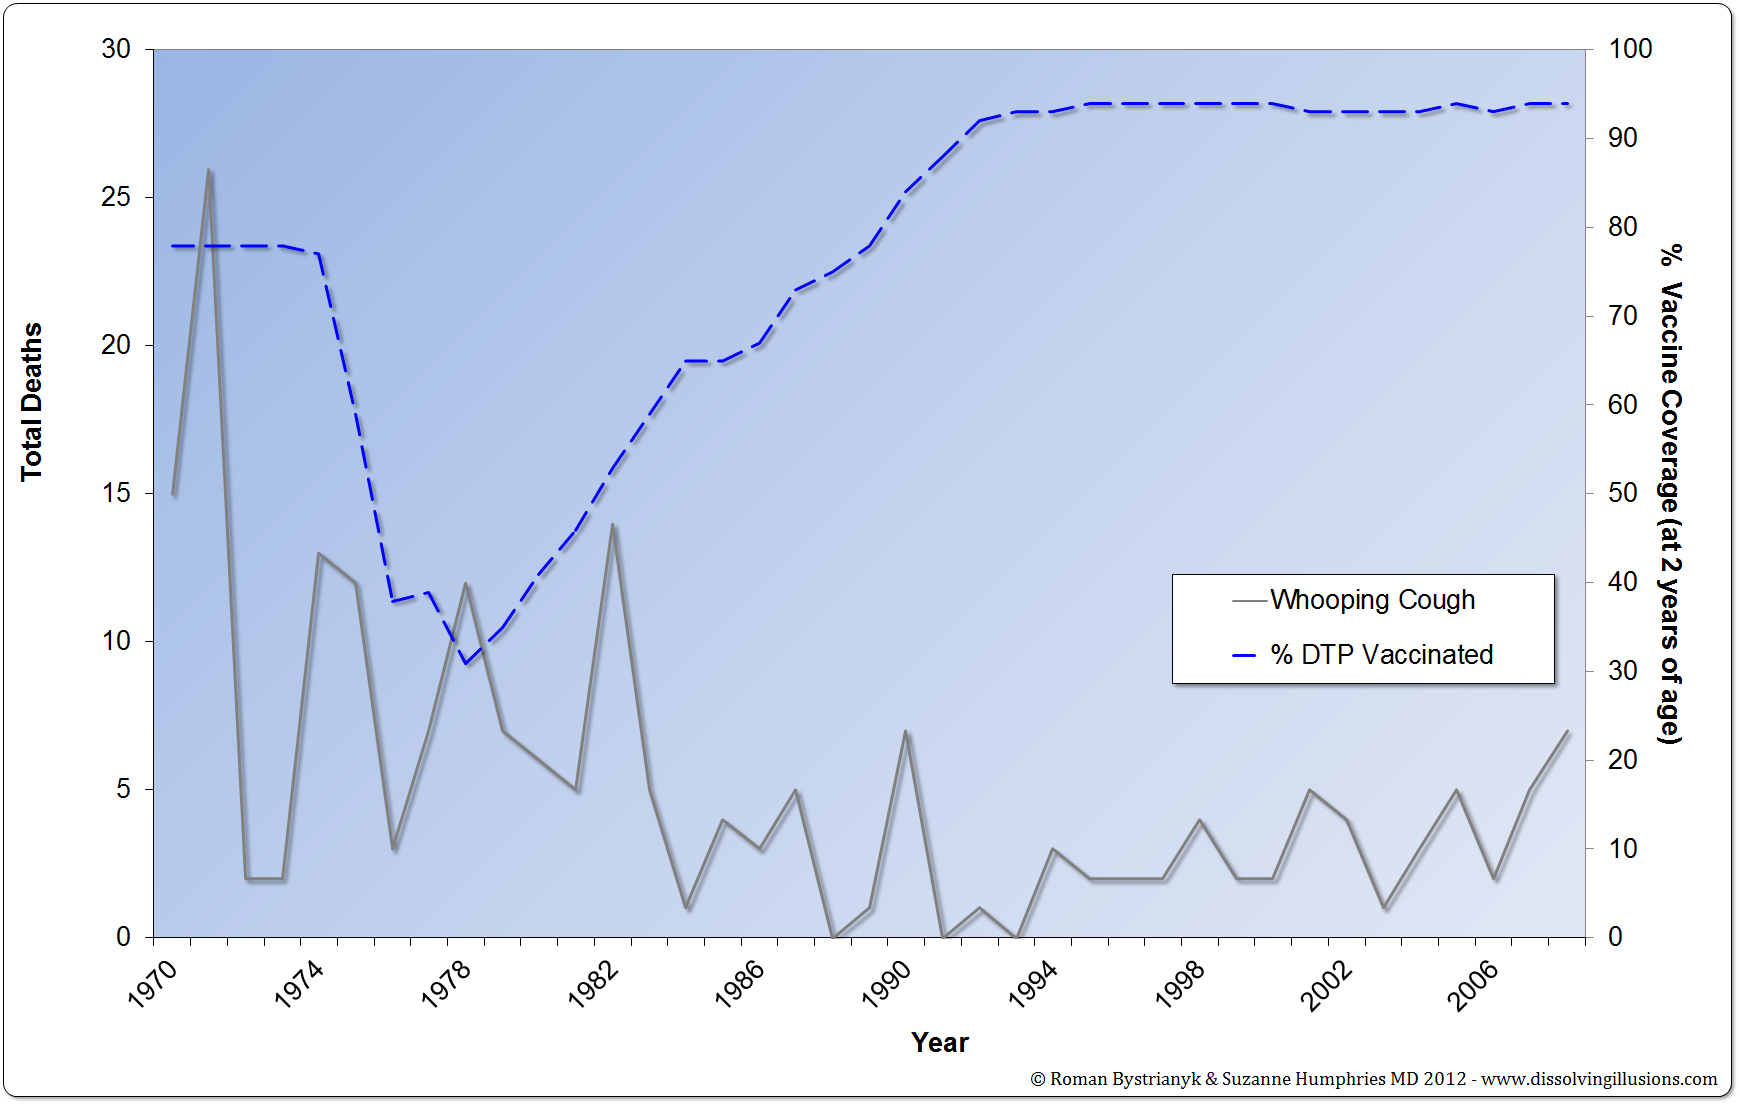
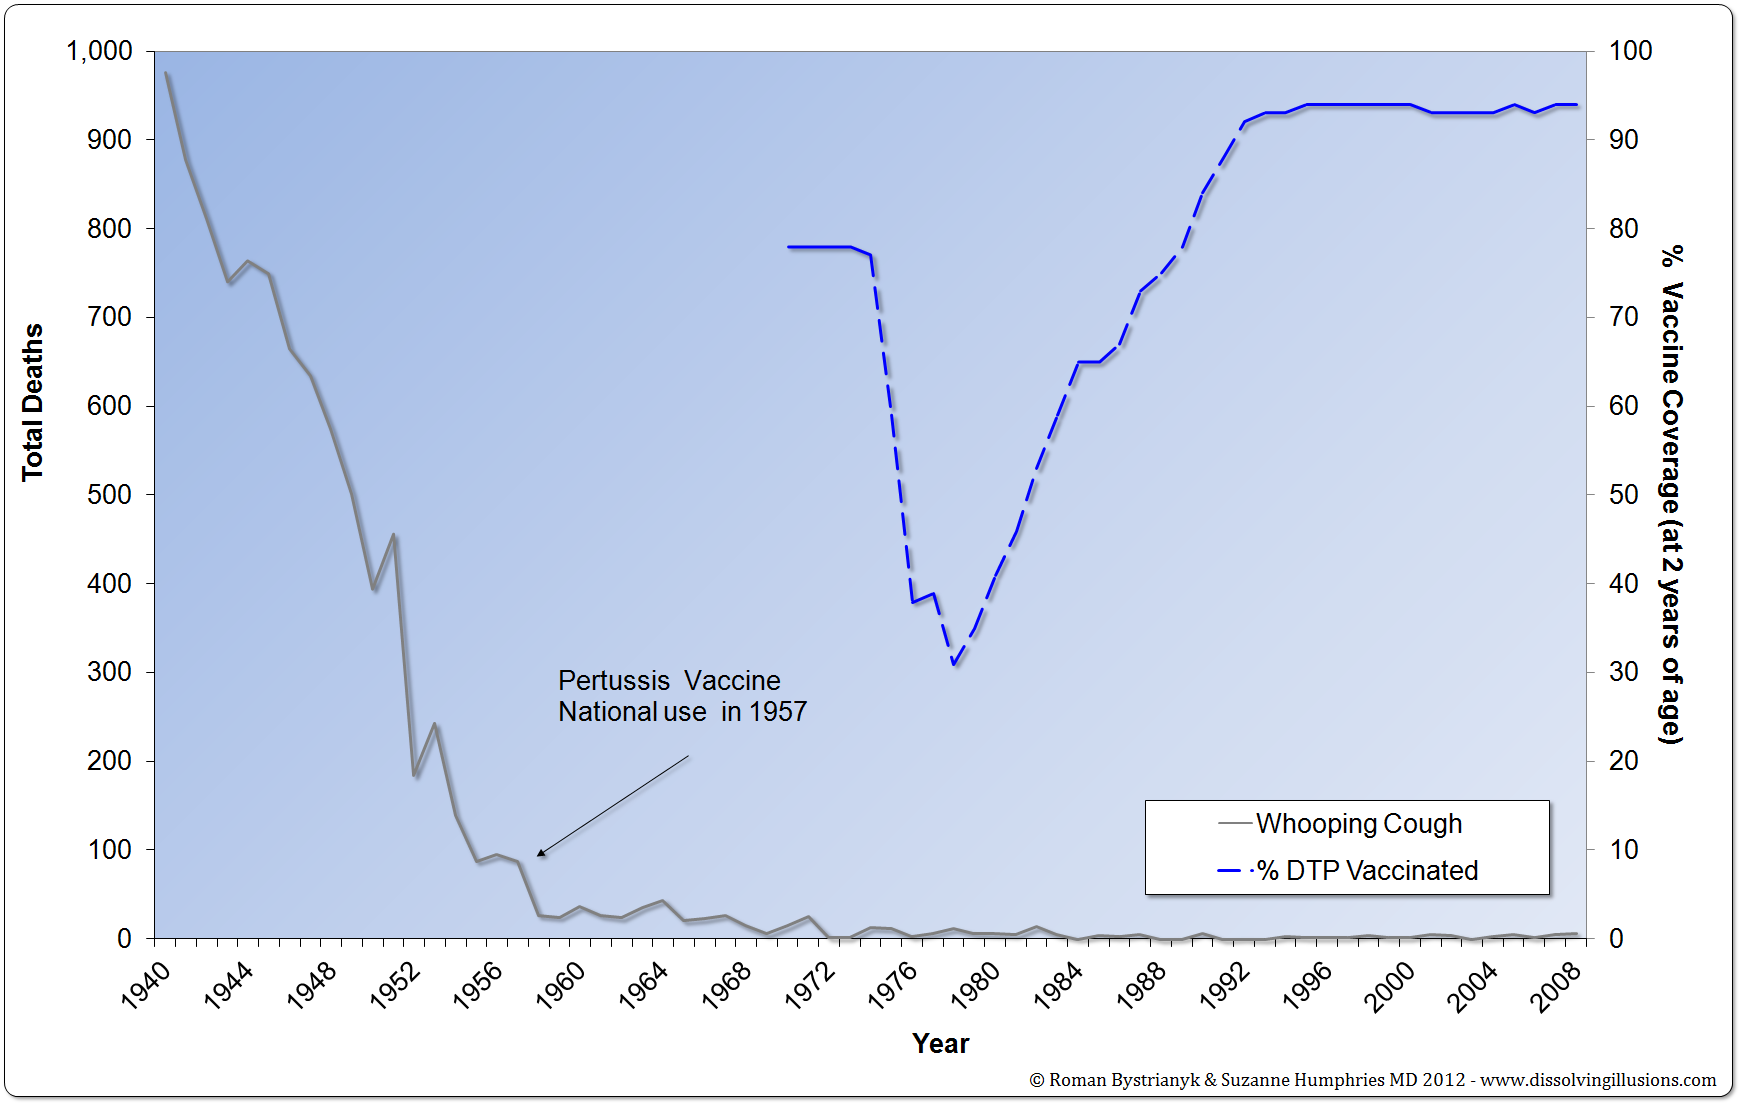
Graph 16.2: England and Wales whooping cough mortality vs. DTP vaccine coverage from 1901 to 2008. (Record of Mortality in England and Wales for 95 years as provided by the office of National Statistics, published 1997; Health Protection Agency Table: Notification of Deaths, England and Wales, 1970–2008) *First Edition: Graph 13.2
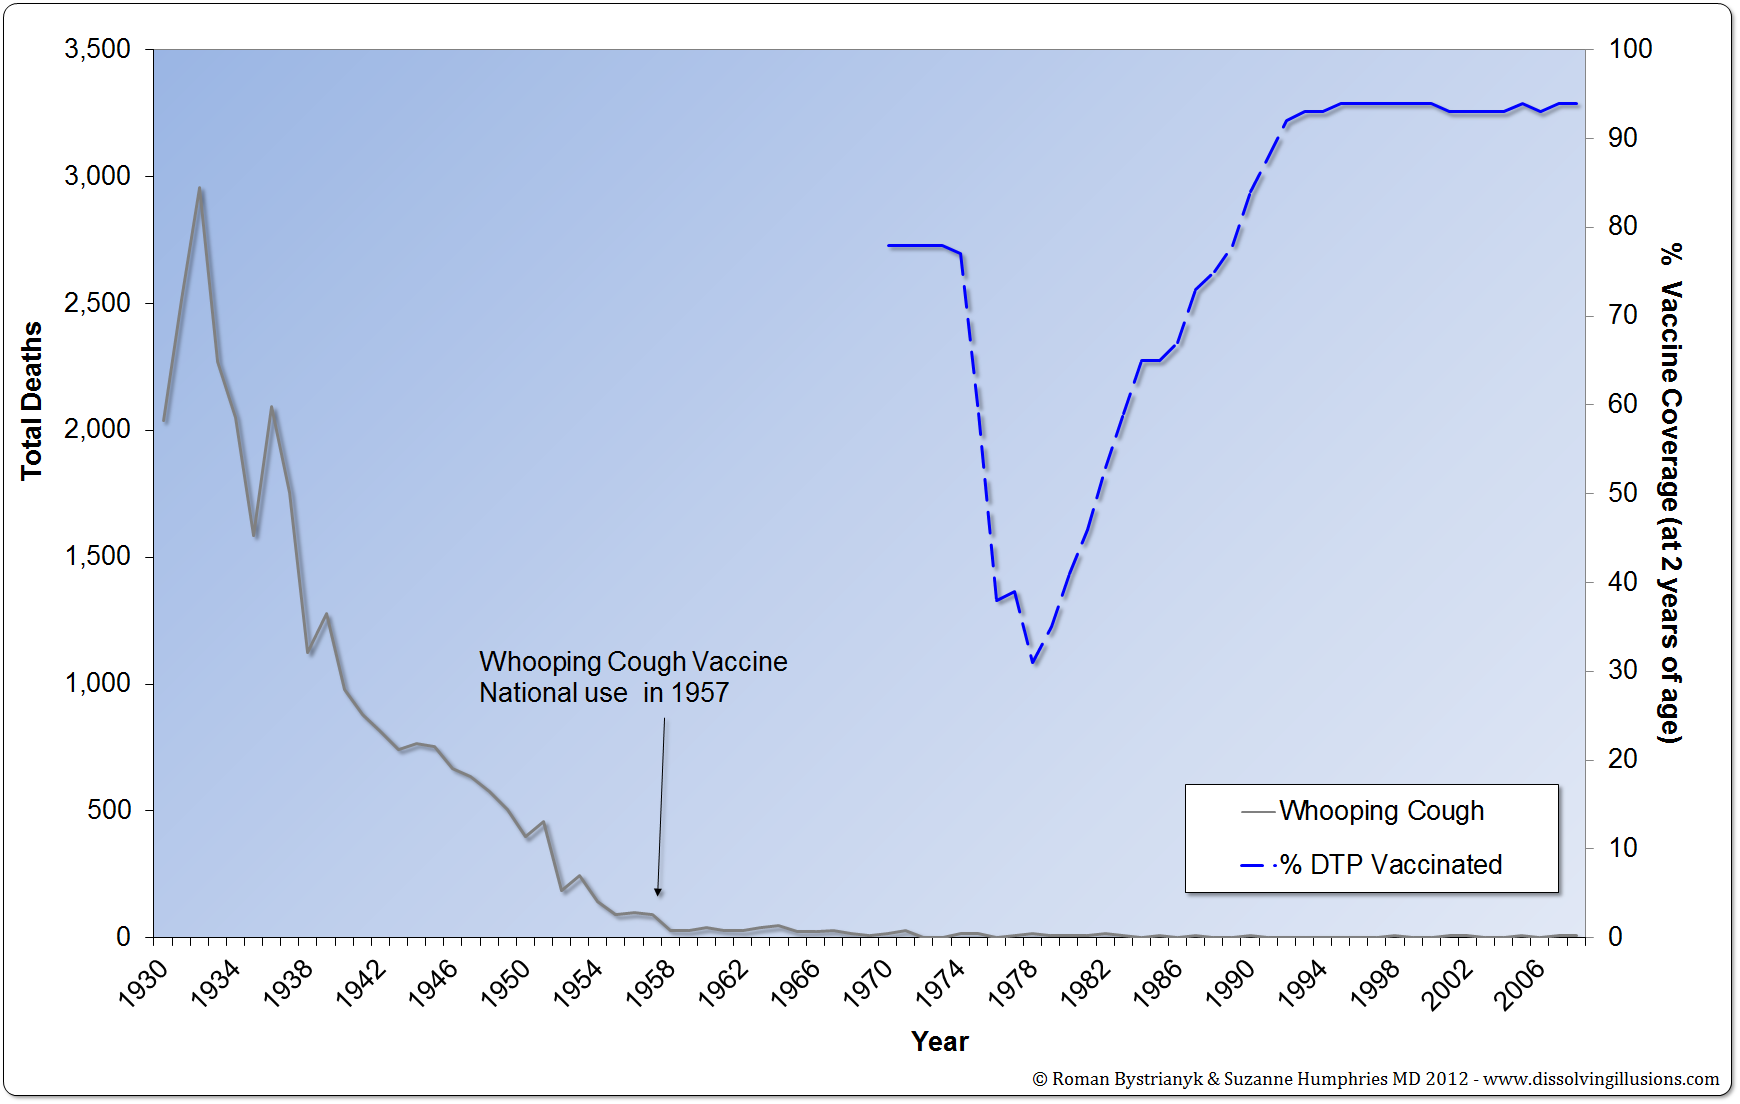
Graph 16.3: England and Wales whooping cough mortality vs. DTP vaccine coverage from 1930 to 2008. (Record of Mortality in England and Wales for 95 years as provided by the office of National Statistics, published 1997; Health Protection Agency Table: Notification of Deaths, England and Wales, 1970–2008) *First Edition: Graph 13.3
Graph 16.4: England and Wales whooping cough mortality vs. DTP vaccine coverage from 1970 to 2008. (Record of Mortality in England and Wales for 95 years as provided by the office of National Statistics, published 1997; Health Protection Agency Table: Notification of Deaths, England and Wales, 1970–2008) *First Edition: Graph 13.4
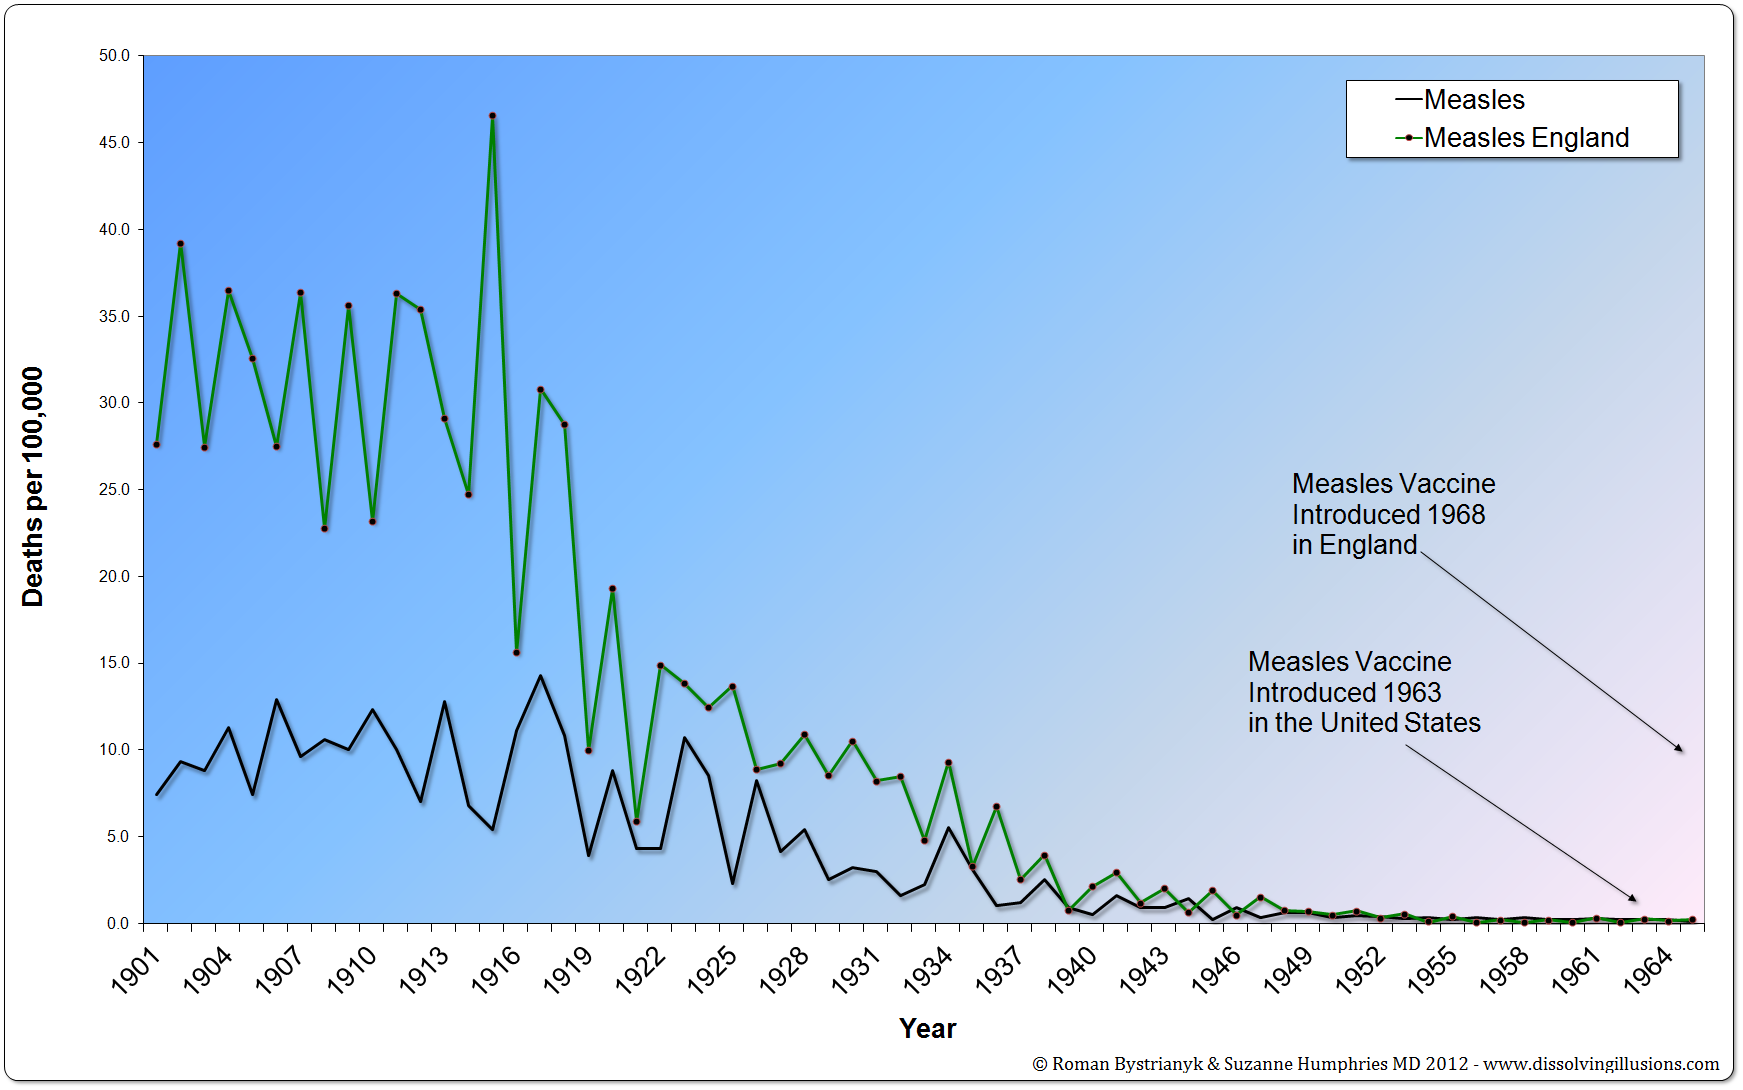
Graph 17.1: Comparison United States and England in mortality rates for measles from 1901 to 1965. (Vital Statistics of the United States 1937, 1938, 1943, 1944, 1949, 1960, 1967, 1976, 1987, 1992; Historical Statistics of the United States—Colonial Times to 1970 Part 1; Record of mortality in England and Wales for 95 years as provided by the Office of National Statistics, published 1997) *First Edition: Graph 14.1
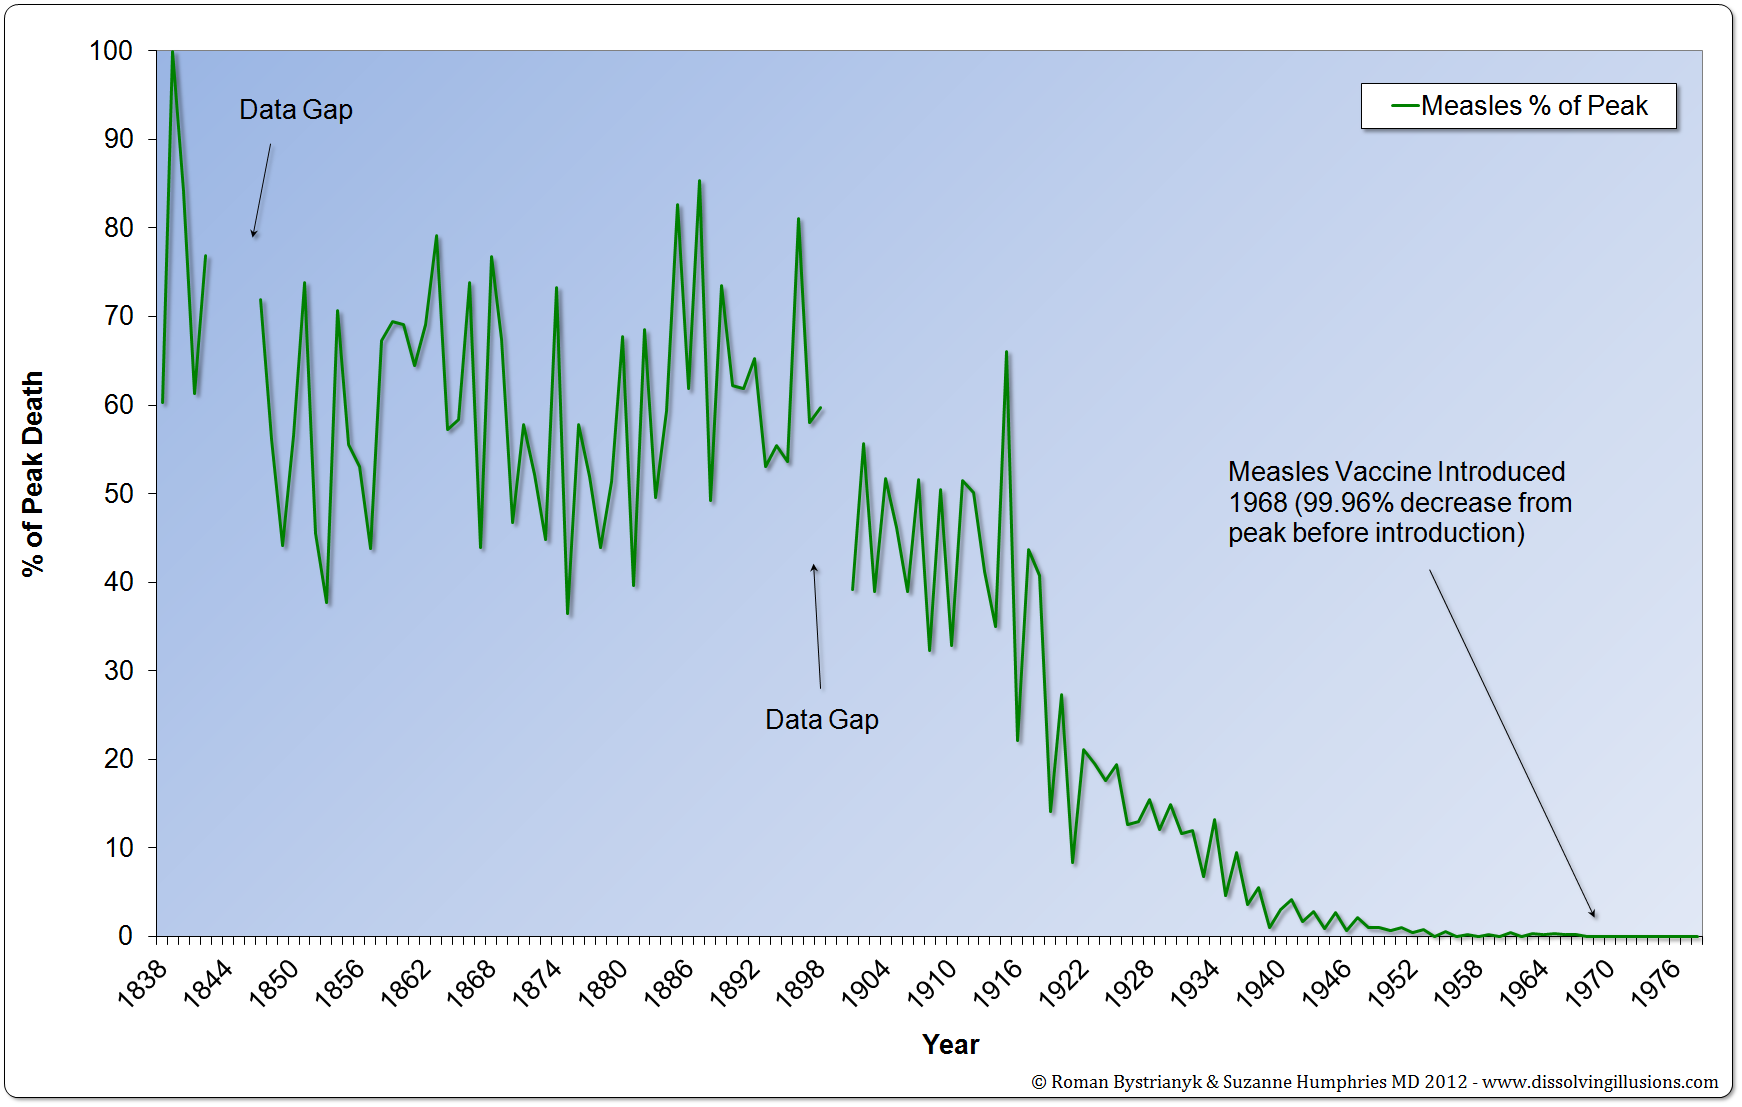
Graph 17.2: England percent decline in mortality rate from peak mortality rate for measles from 1838 to 1978. (Record of mortality in England and Wales for 95 years as provided by the Office of National Statistics, published 1997; Report to The Honourable Sir George Cornewall Lewis, Bart, MP, Her Majesty’s Principal Secretary of State for the Home Department, June 30, 1860, pp. a4, 205; Essay on Vaccination by Charles T. Pearce, MD, Member of the Royal College of Surgeons of England; Parliamentary Papers, the 62nd Annual Return of the Registrar General 1899 (1891–1898)) *First Edition: Graph 14.2
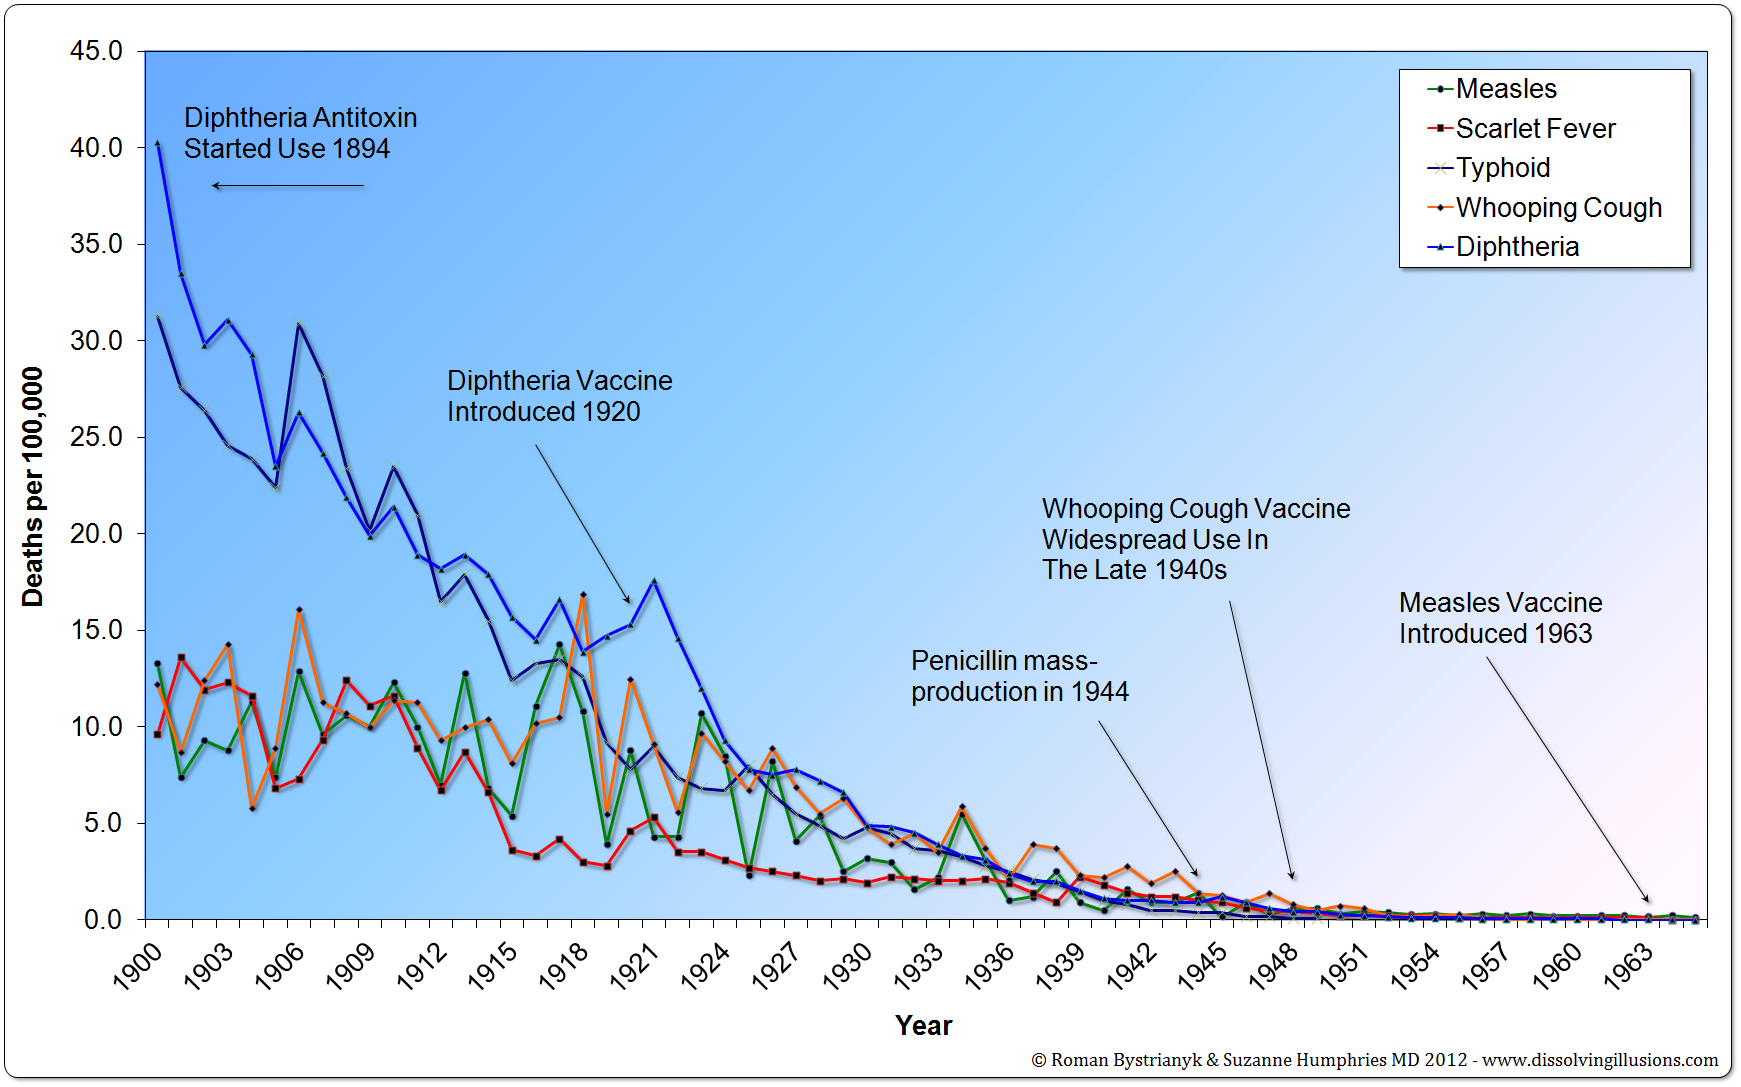
Graph 17.3: United States mortality rates from various infectious diseases from 1900 to 1965. (Vital Statistics of the United States 1937, 1938, 1943, 1944, 1949, 1960, 1967, 1976, 1987, 1992; Historical Statistics of the United States—Colonial Times to 1970 Part 1; Health, United States, 2004, US Department of Health and Human Services; Vital Records & Health Data Development Section, Michigan Department of Community Health; US Census Bureau, Statistical Abstract of the United States: 2003; Reported Cases and Deaths from Vaccine Preventable Diseases, United States, 1950–2008) *First Edition: Graph 14.3
Graph 17.4: United States mortality rates from various infectious diseases from 1920 to 1955. (Vital Statistics of the United States 1937, 1938, 1943, 1944, 1949, 1960, 1967, 1976, 1987, 1992; Historical Statistics of the United States—Colonial Times to 1970 Part 1; Health, United States, 2004, US Department of Health and Human Services; Vital Records & Health Data Development Section, Michigan Department of Community Health; US Census Bureau, Statistical Abstract of the United States: 2003; Reported Cases and Deaths from Vaccine Preventable Diseases, United States, 1950–2008) *First Edition: Graph 14.4
Graph 17.5: Massachusetts mortality rate from measles from 1861 to 1970. (Historical Statistics of the United States—Colonial Times to 1970 Part 1, Bureau of the Census, p. 63) *First Edition: Graph 14.5
Graph 17.6: Washington State measles mortality rate from 1920 to 1982. (Communicable Disease Statistical Summary, Washington State 1920–1983, Office of Public Health Laboratory, Seattle, WA) *First Edition: Graph 14.6
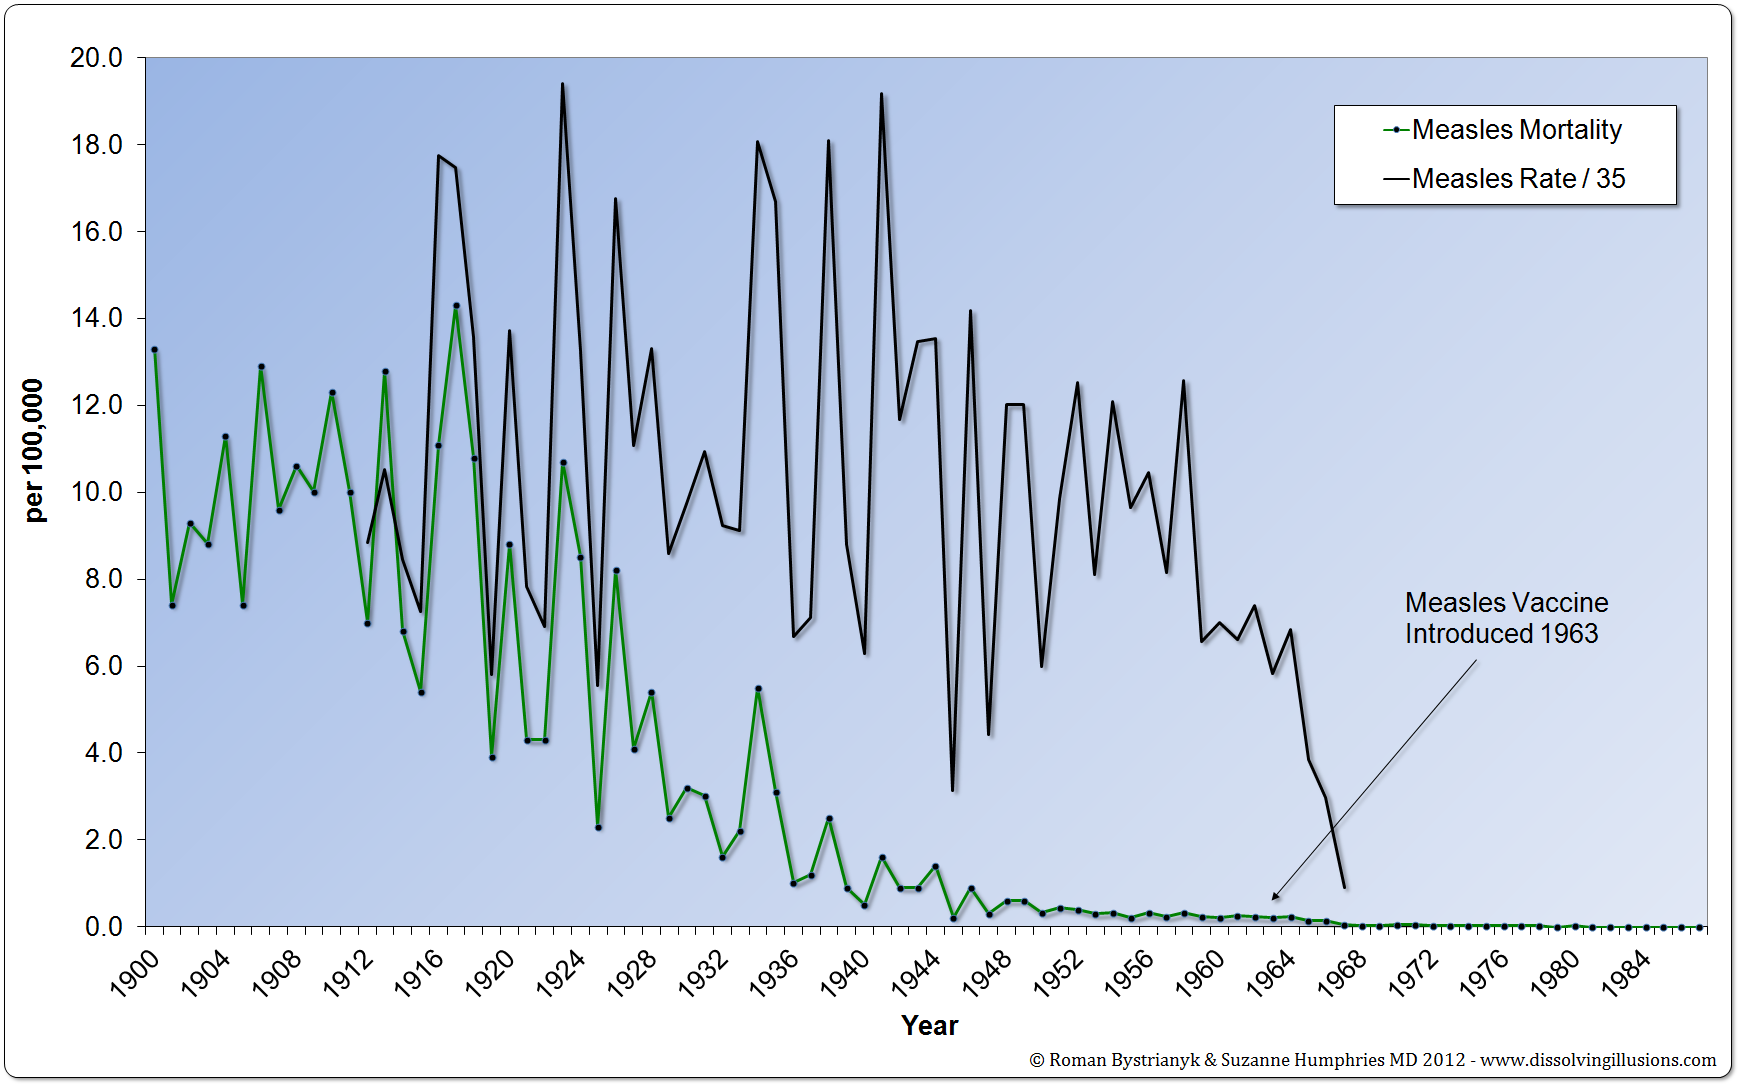
Graph 17.7: United States measles mortality rate with 1/35 measles disease rate from 1900 to 1987. (Vital Statistics of the United States 1937, 1938, 1943, 1944, 1949, 1960, 1967, 1976, 1987, 1992; Historical Statistics of the United States—Colonial Times to 1970 Part 1) *First Edition: Graph 14.7
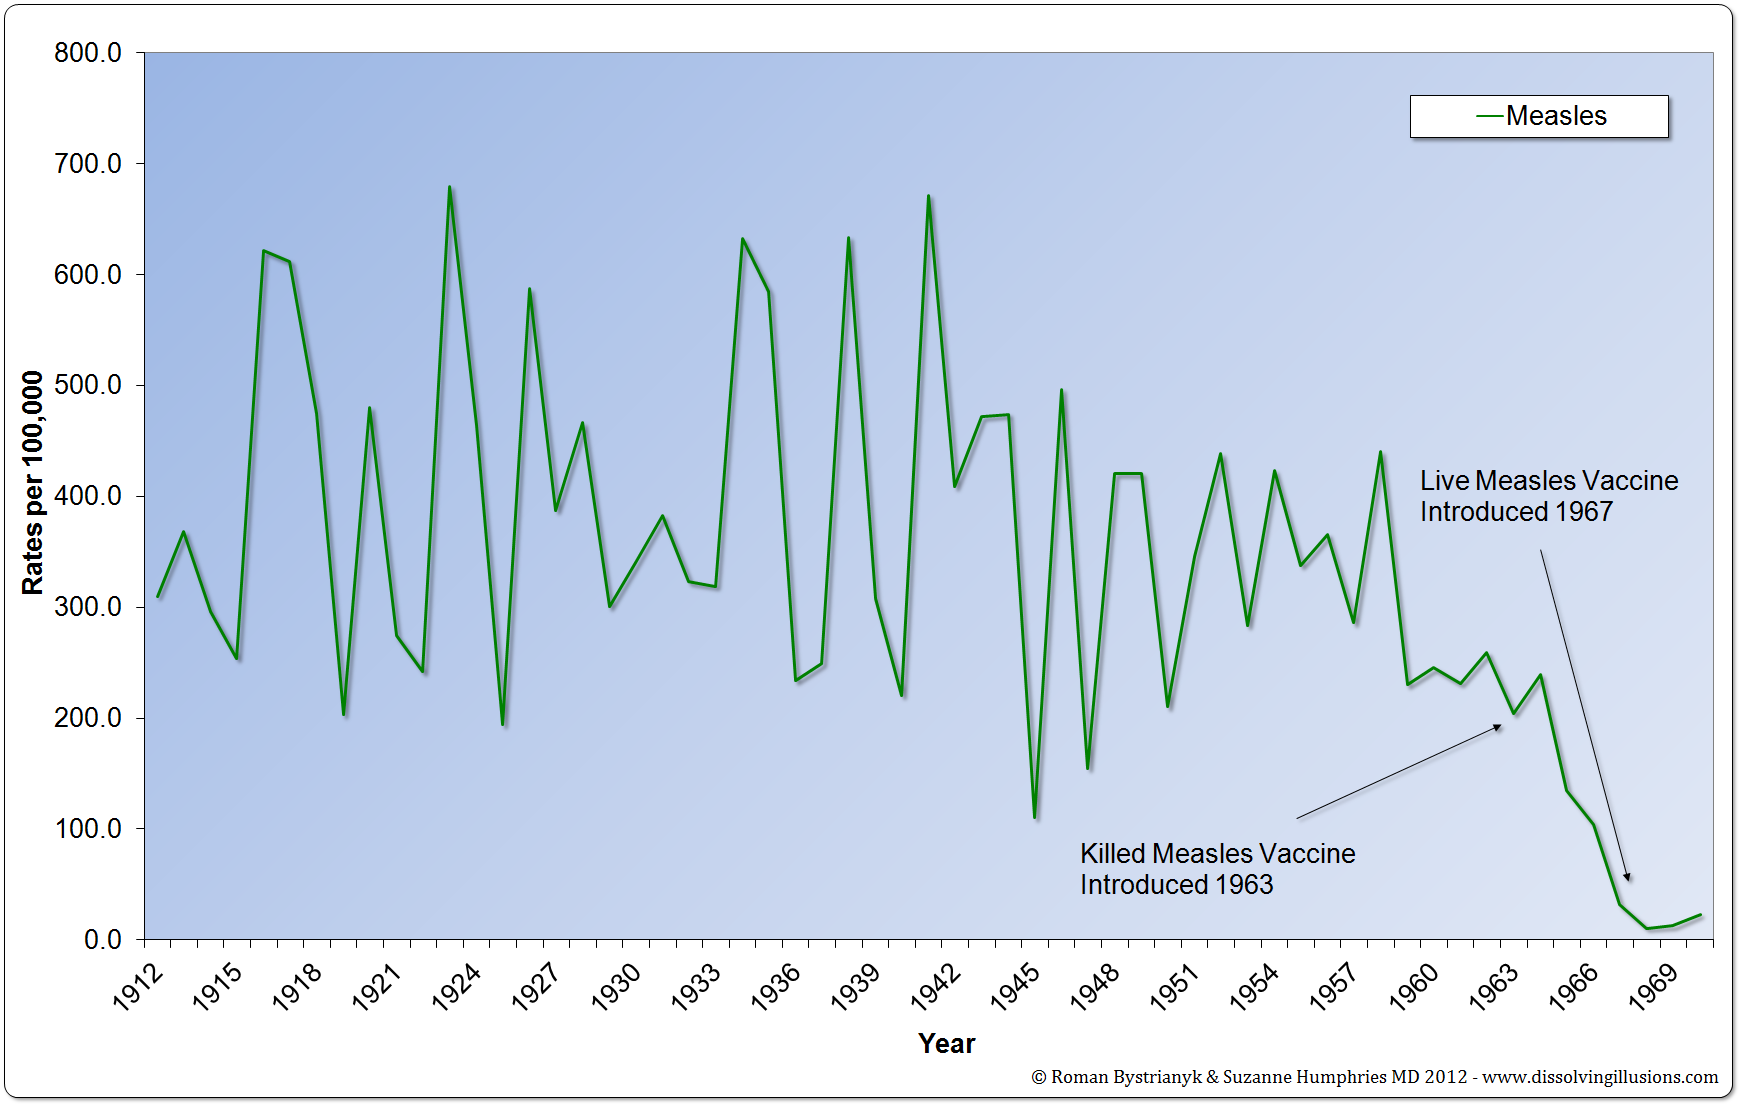
Graph 17.8: United States measles incidence from 1912 to 1970. (Historical Statistics of the United States—Colonial Times to 1970 Part 1; Bureau of the Census, 1975, pp. 77) *First Edition: Graph 14.8
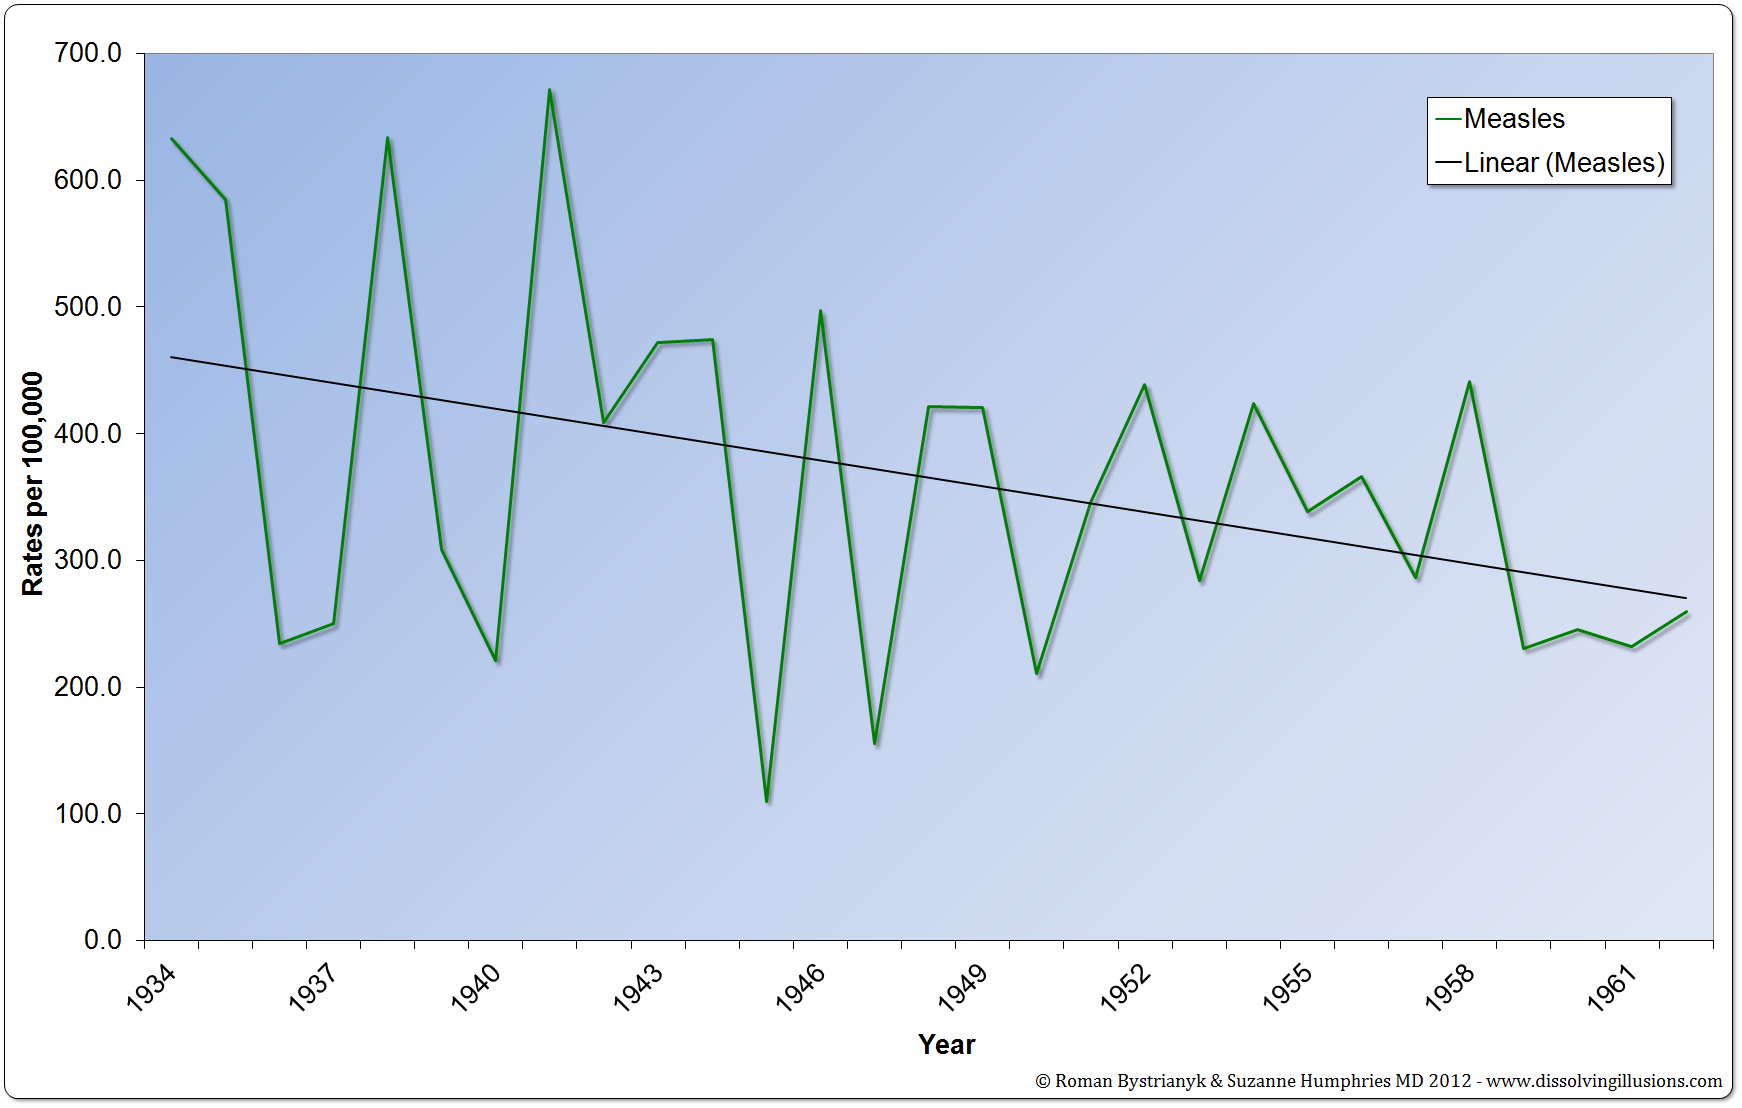
Graph 17.9: United States measles incidence from 1934 to 1962. (Historical Statistics of the United States—Colonial Times to 1970 Part 1; Bureau of the Census, 1975, pp. 77) *First Edition: Graph 14.9
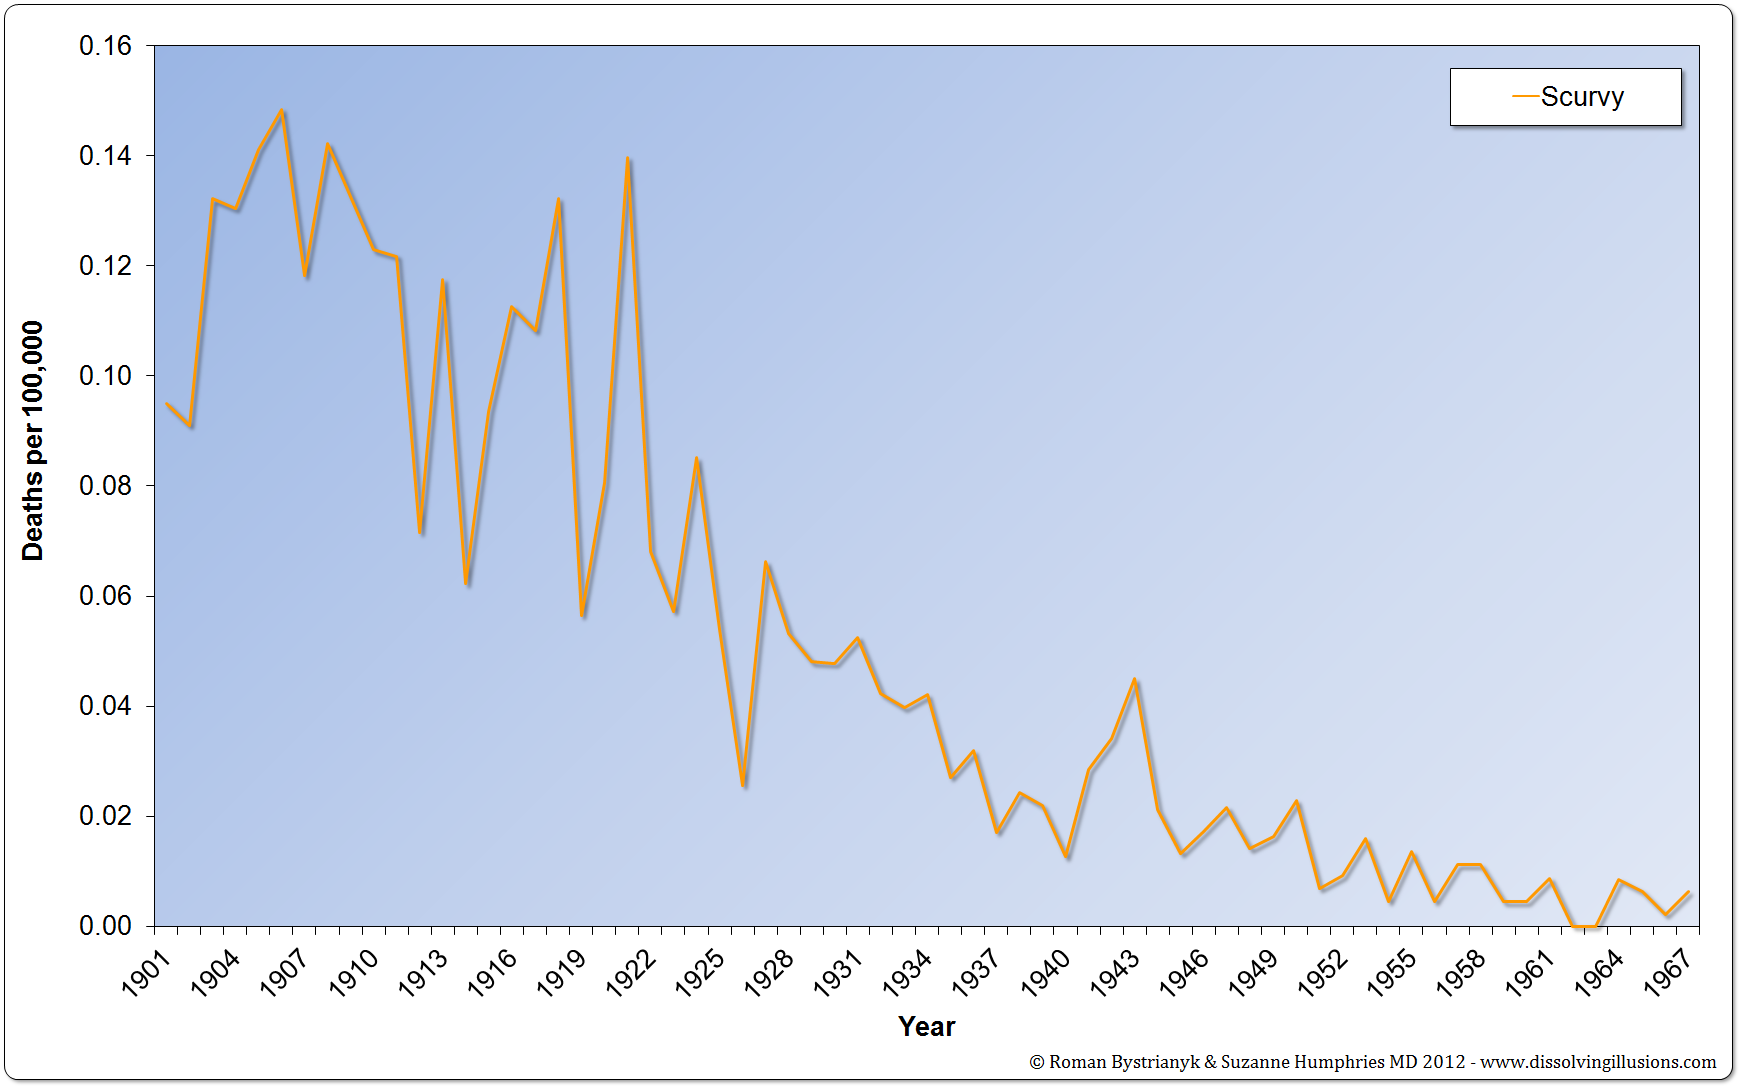
Graph 18.1: England mortality rate from scurvy from 1901 to 1967. (Record of mortality in England and Wales for 95 years as provided by the Office of National Statistics, 1997) *First Edition: Graph 15.1
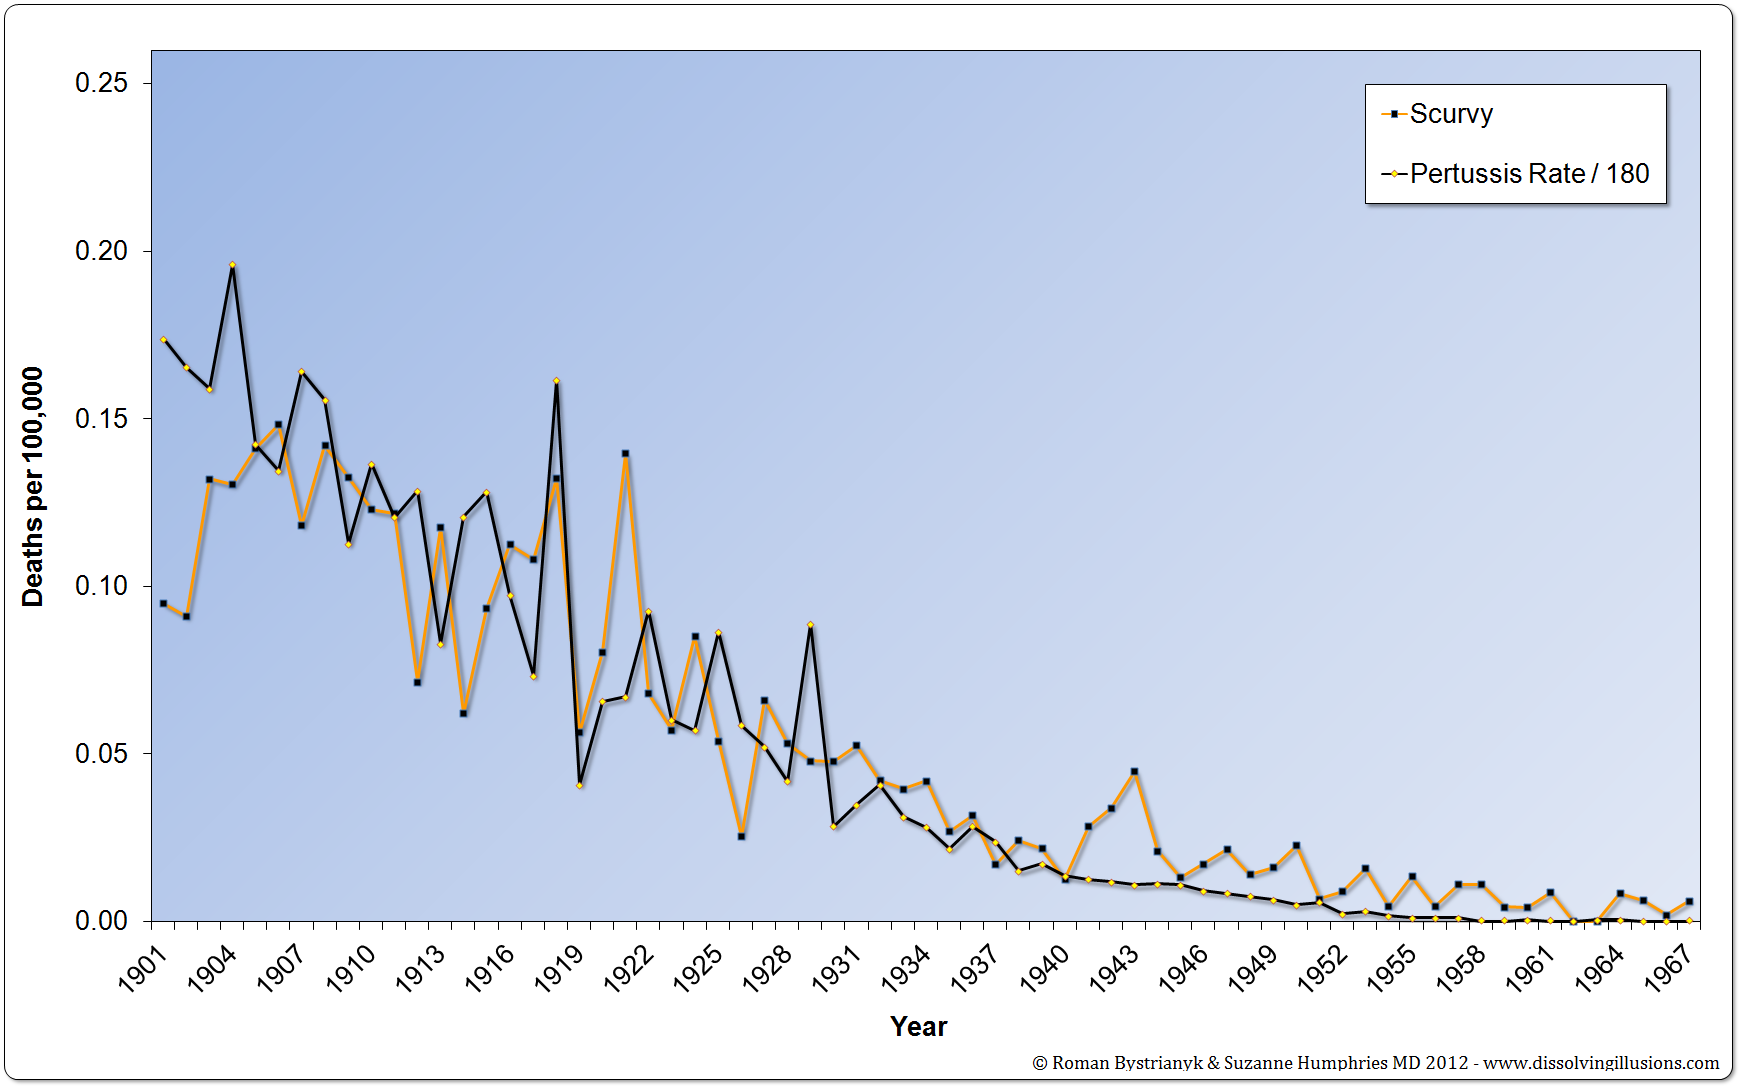
Graph 18.2: England mortality rates from scurvy vs. whooping cough from 1901 to 1967. (Record of mortality in England and Wales for 95 years as provided by the Office of National Statistics, 1997) *First Edition: Graph 15.2
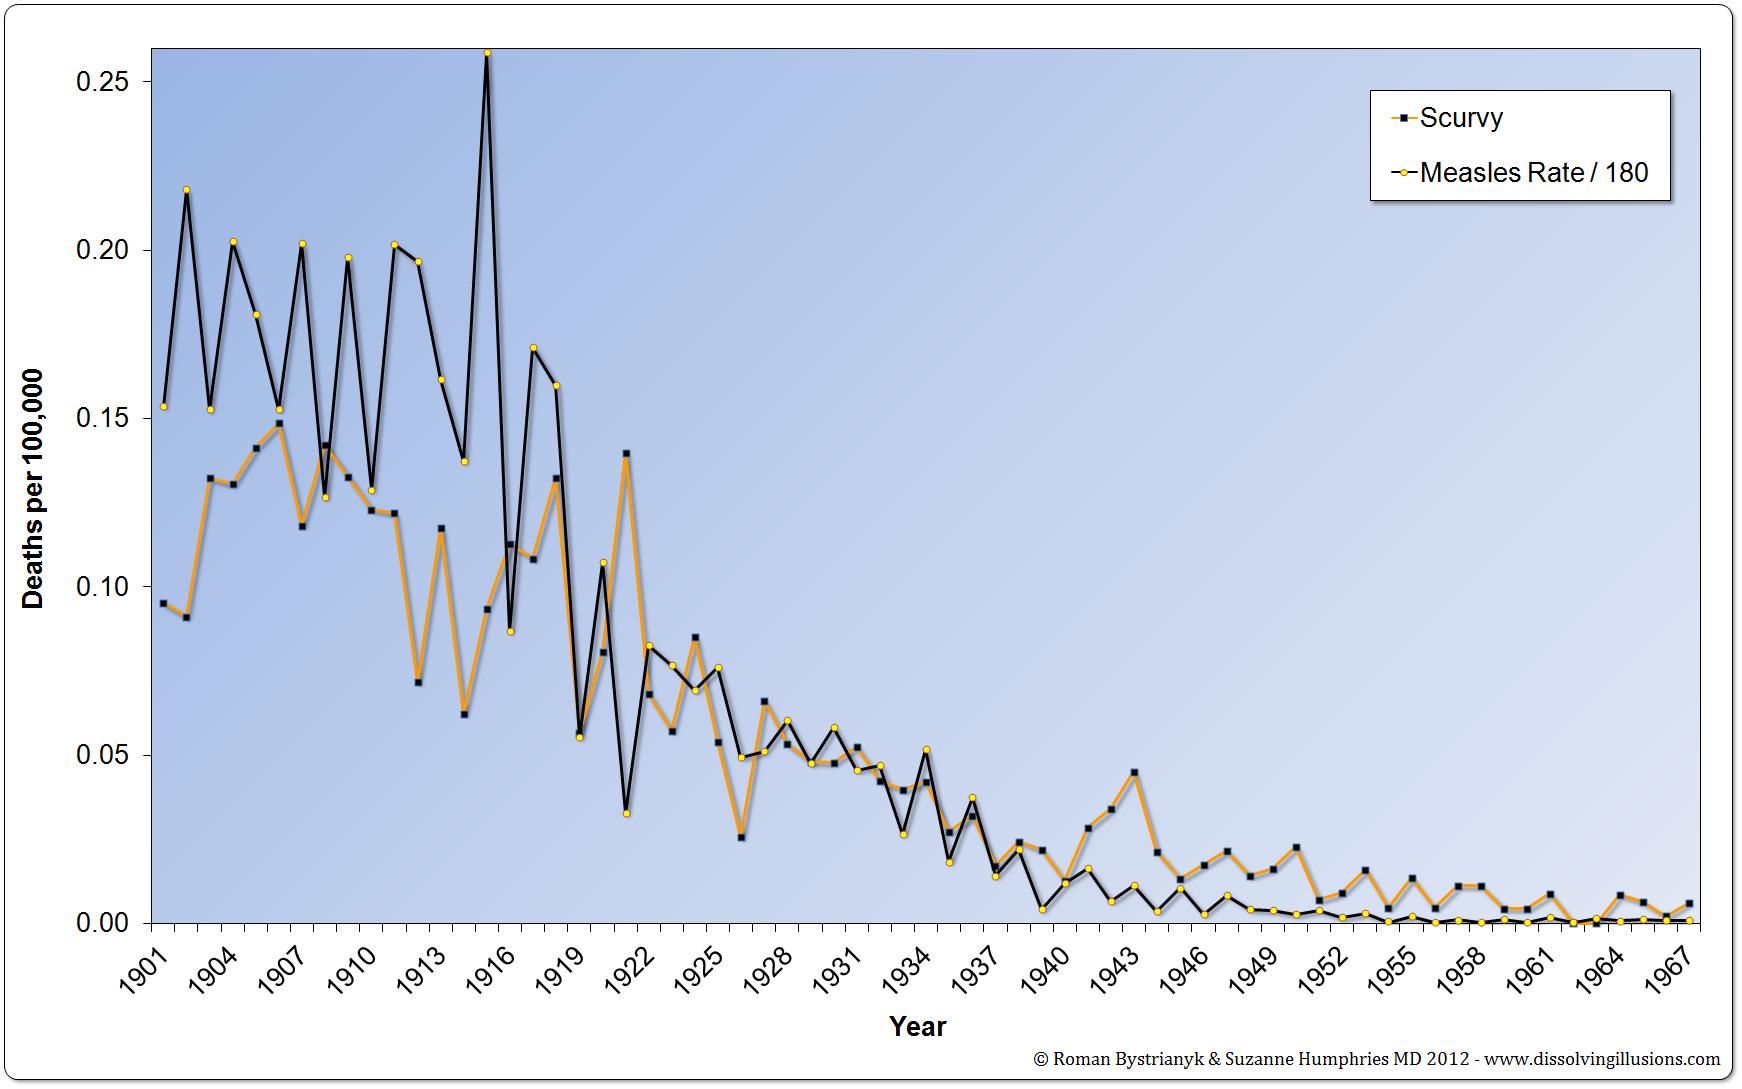
Graph 18.3: England mortality rates from scurvy vs. measles from 1901 to 1967. (Record of mortality in England and Wales for 95 years as provided by the Office of National Statistics, 1997) *First Edition: Graph 15.3
Graph 20.1: Leicester, England, smallpox mortality rate vs. smallpox vaccination coverage from 1849 to 1910. (Leicester: Sanitation Versus Vaccination, J. T. Biggs, JP, 1912, pp. 720–722) *First Edition: Graph 17.1
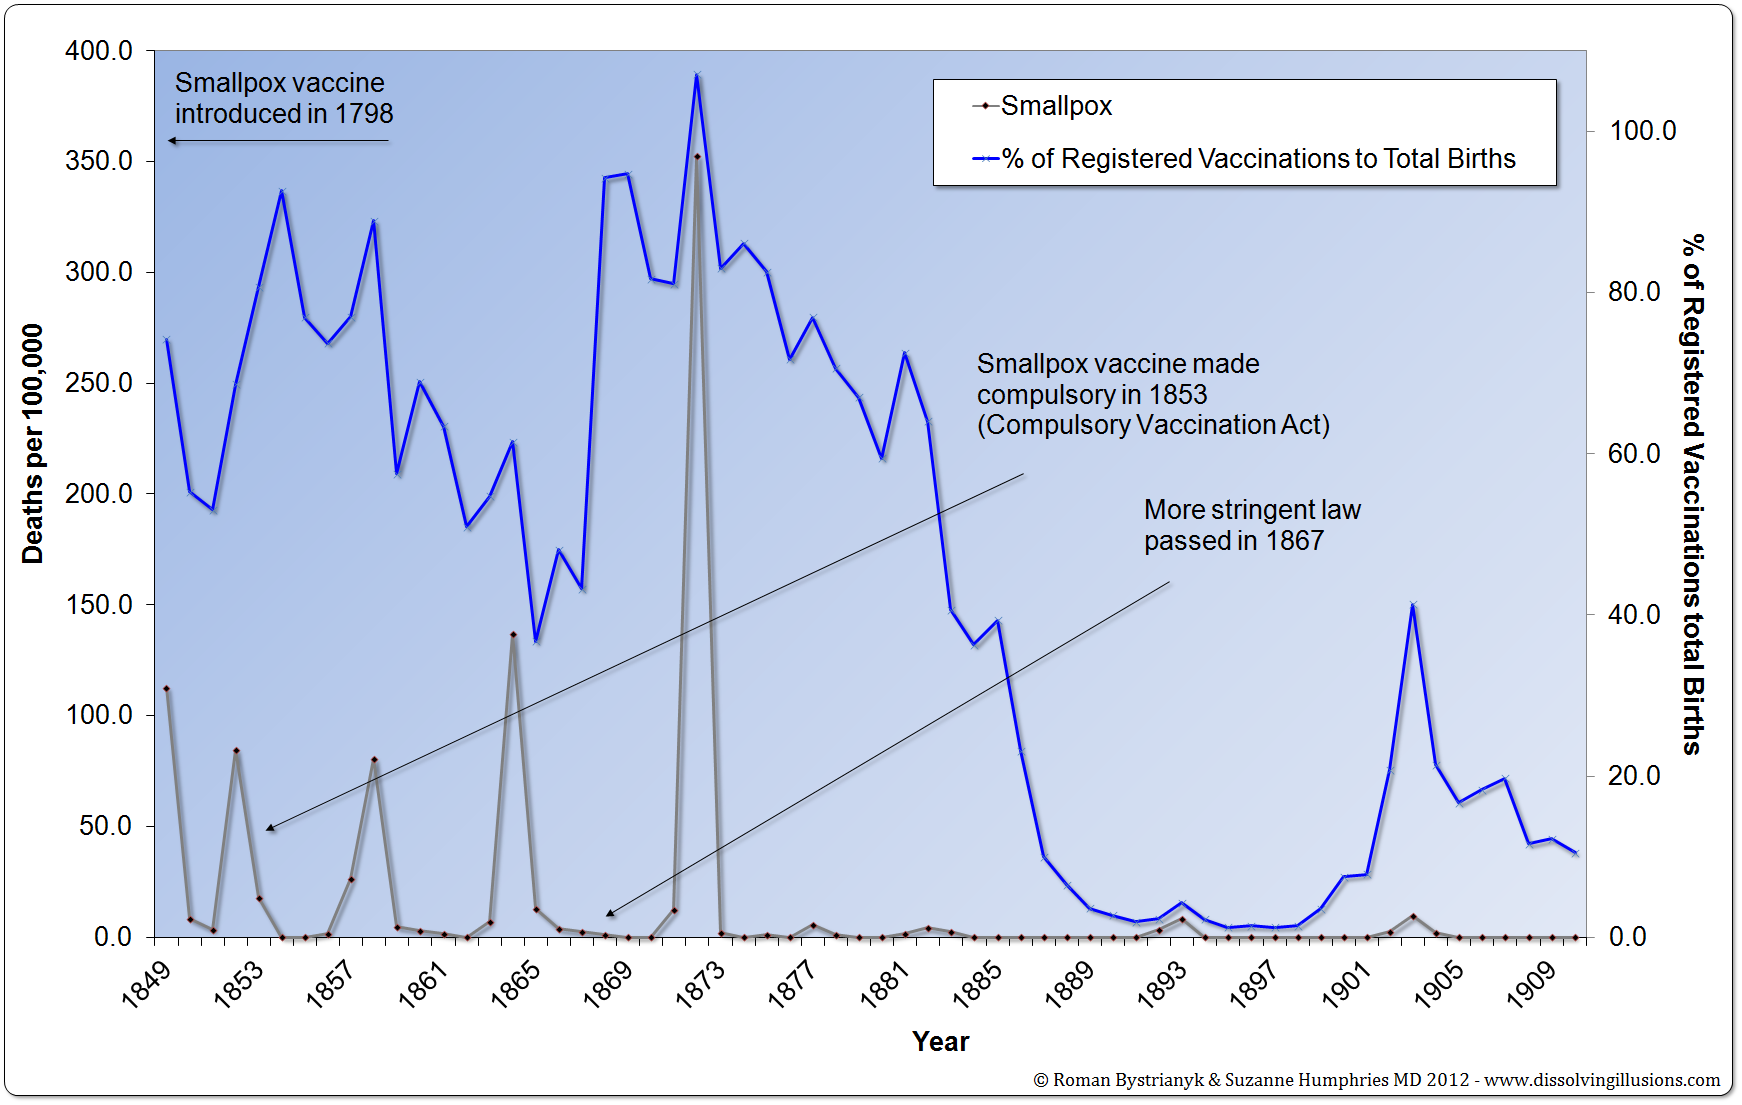
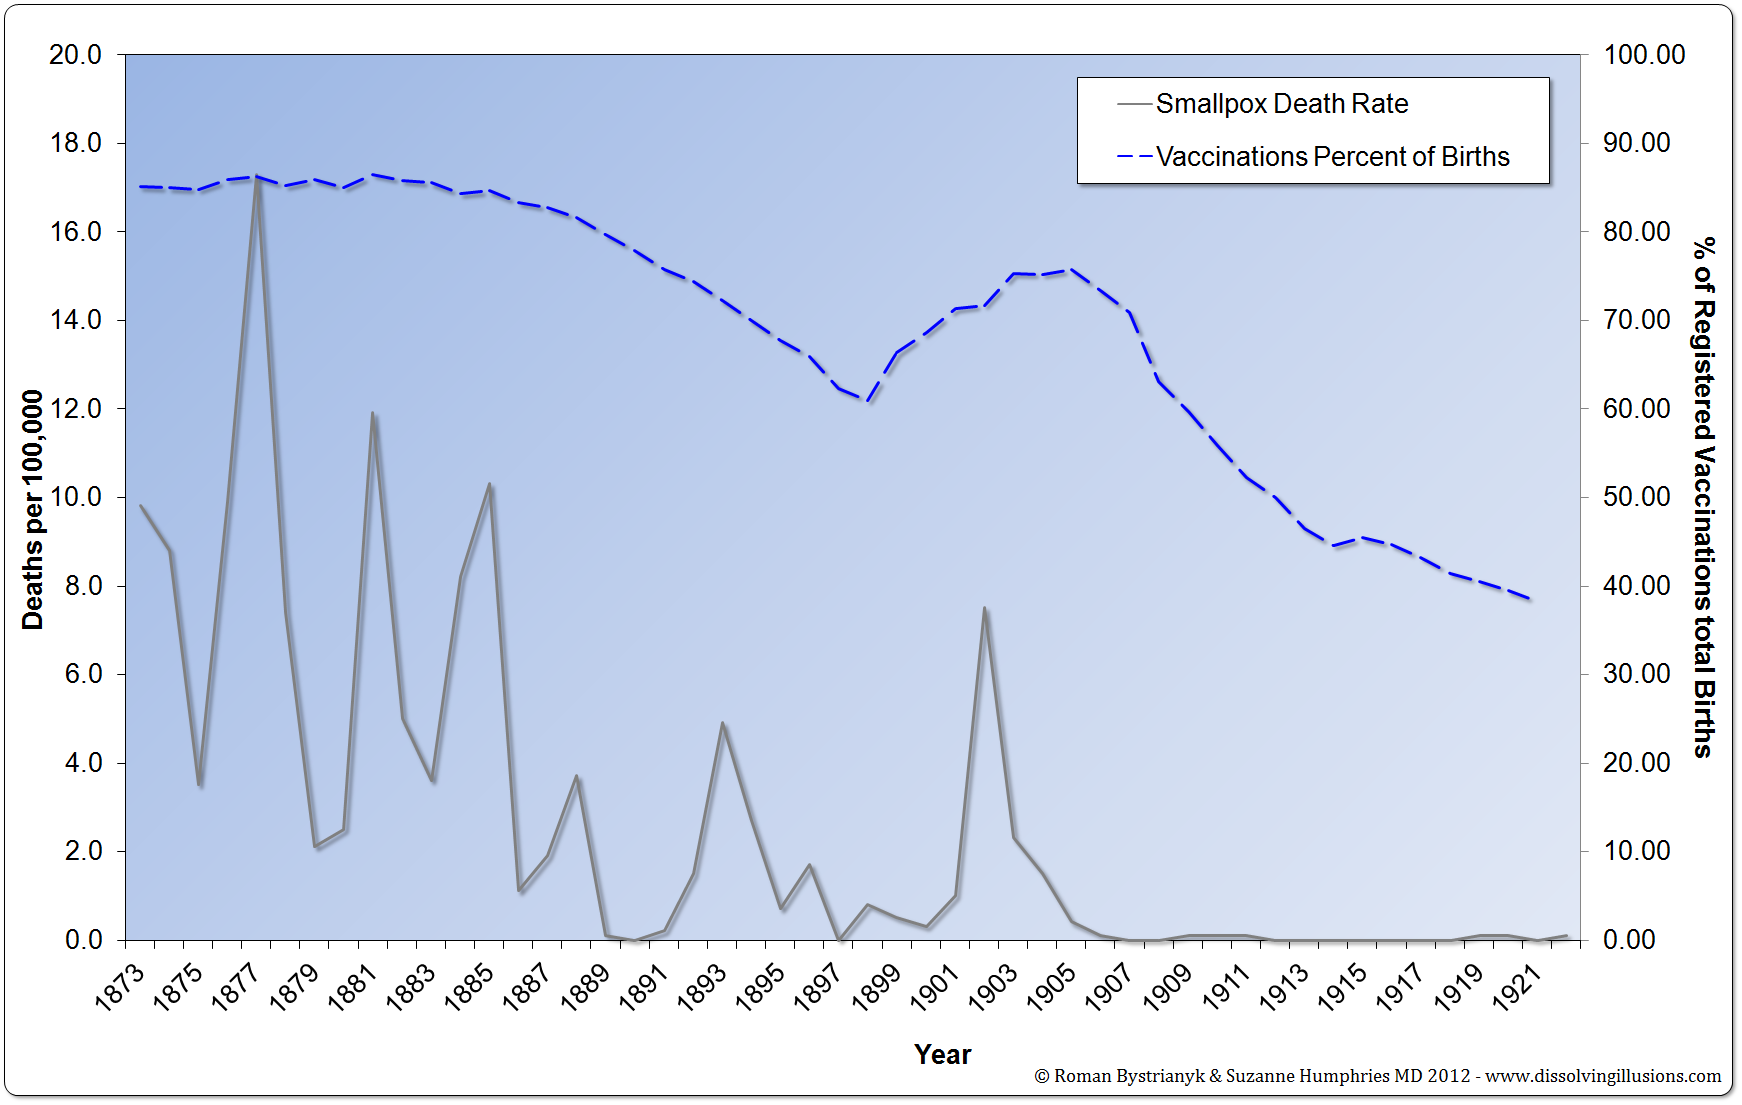
Graph 20.2: England and Wales smallpox mortality rate vs. smallpox vaccine coverage rates from 1873 to 1922. (Written answer by Lord E. Percy to Parliamentary question addressed by Mr. March, MP, to the Minister to Health on July 16, 1923) *First Edition: Graph 17.2
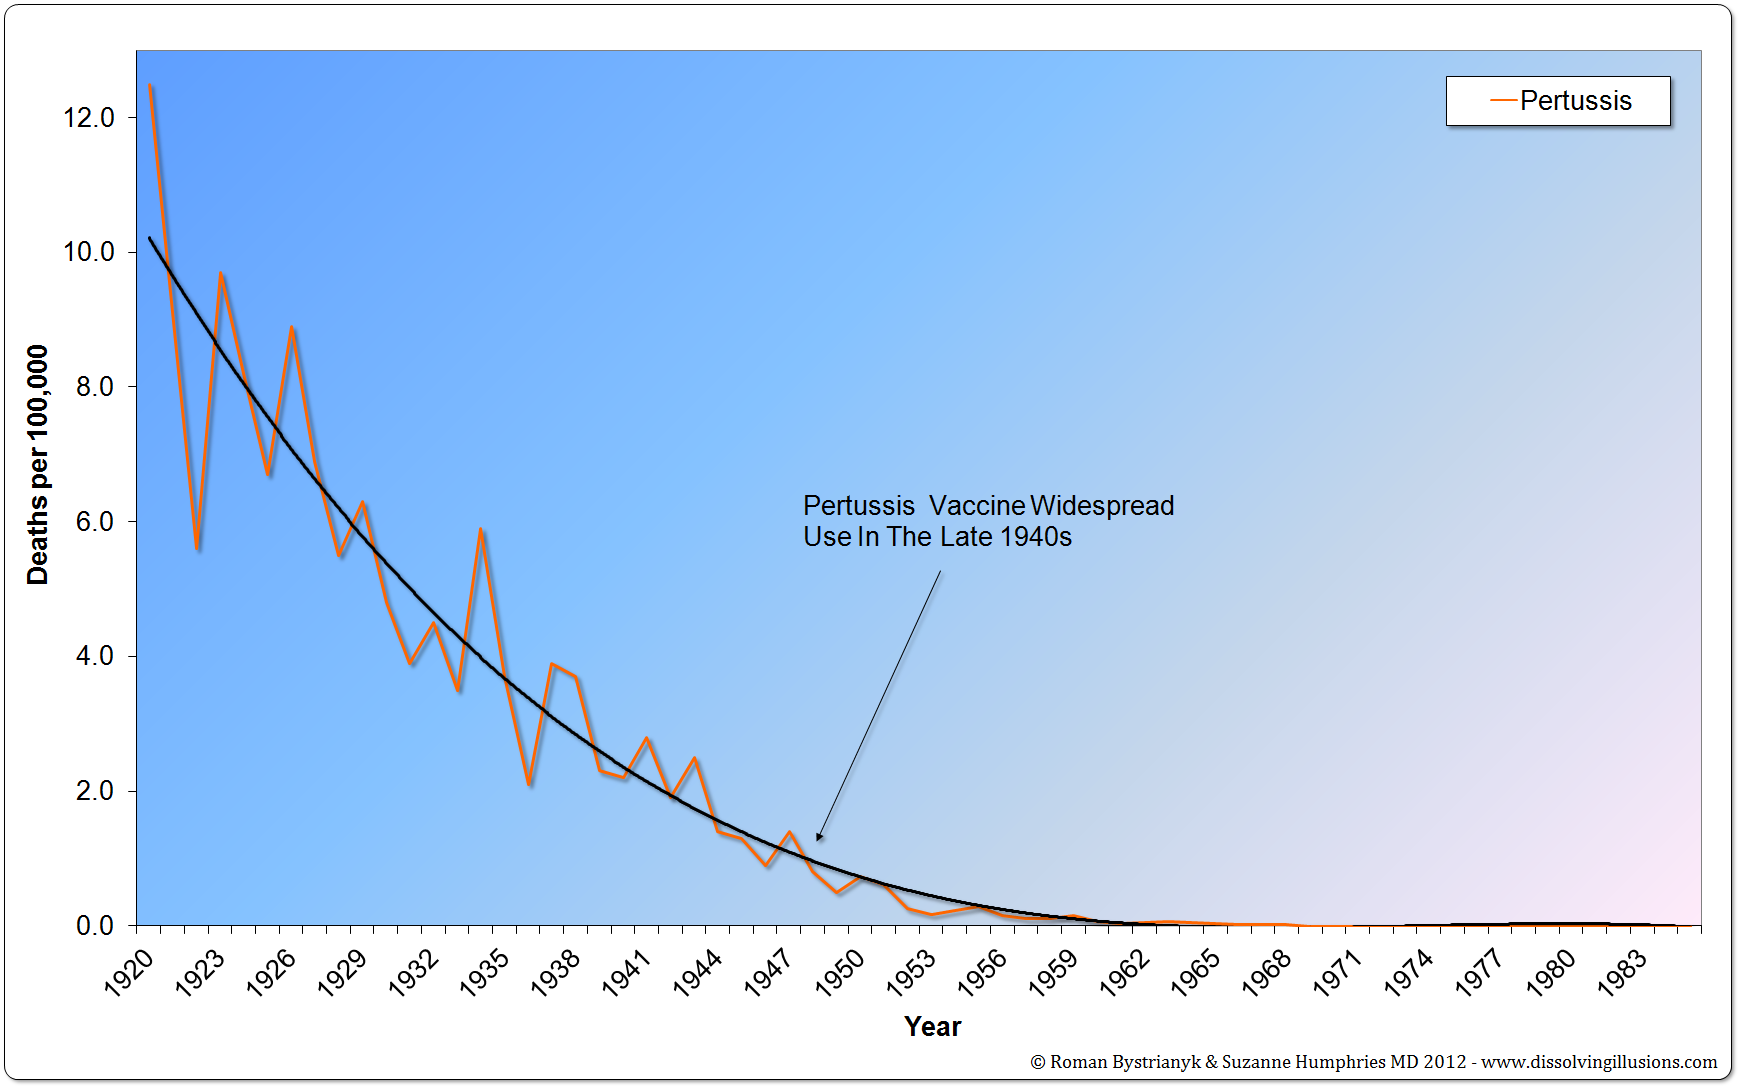
Graph 20.3: United States whooping cough mortality rate from 1920 to 1985. (Vital Statistics of the United States 1937, 1938, 1943, 1944, 1949, 1960, 1967, 1976, 1987, 1992; Historical Statistics of the United States—Colonial Times to 1970 Part 1; Health, United States, 2004, US Department of Health and Human Services; Vital Records & Health Data Development Section, Michigan Department of Community Health; US Census Bureau, Statistical Abstract of the United States: 2003; Reported Cases and Deaths from Vaccine Preventable Diseases, United States, 1950–2008) *First Edition: Graph 17.3
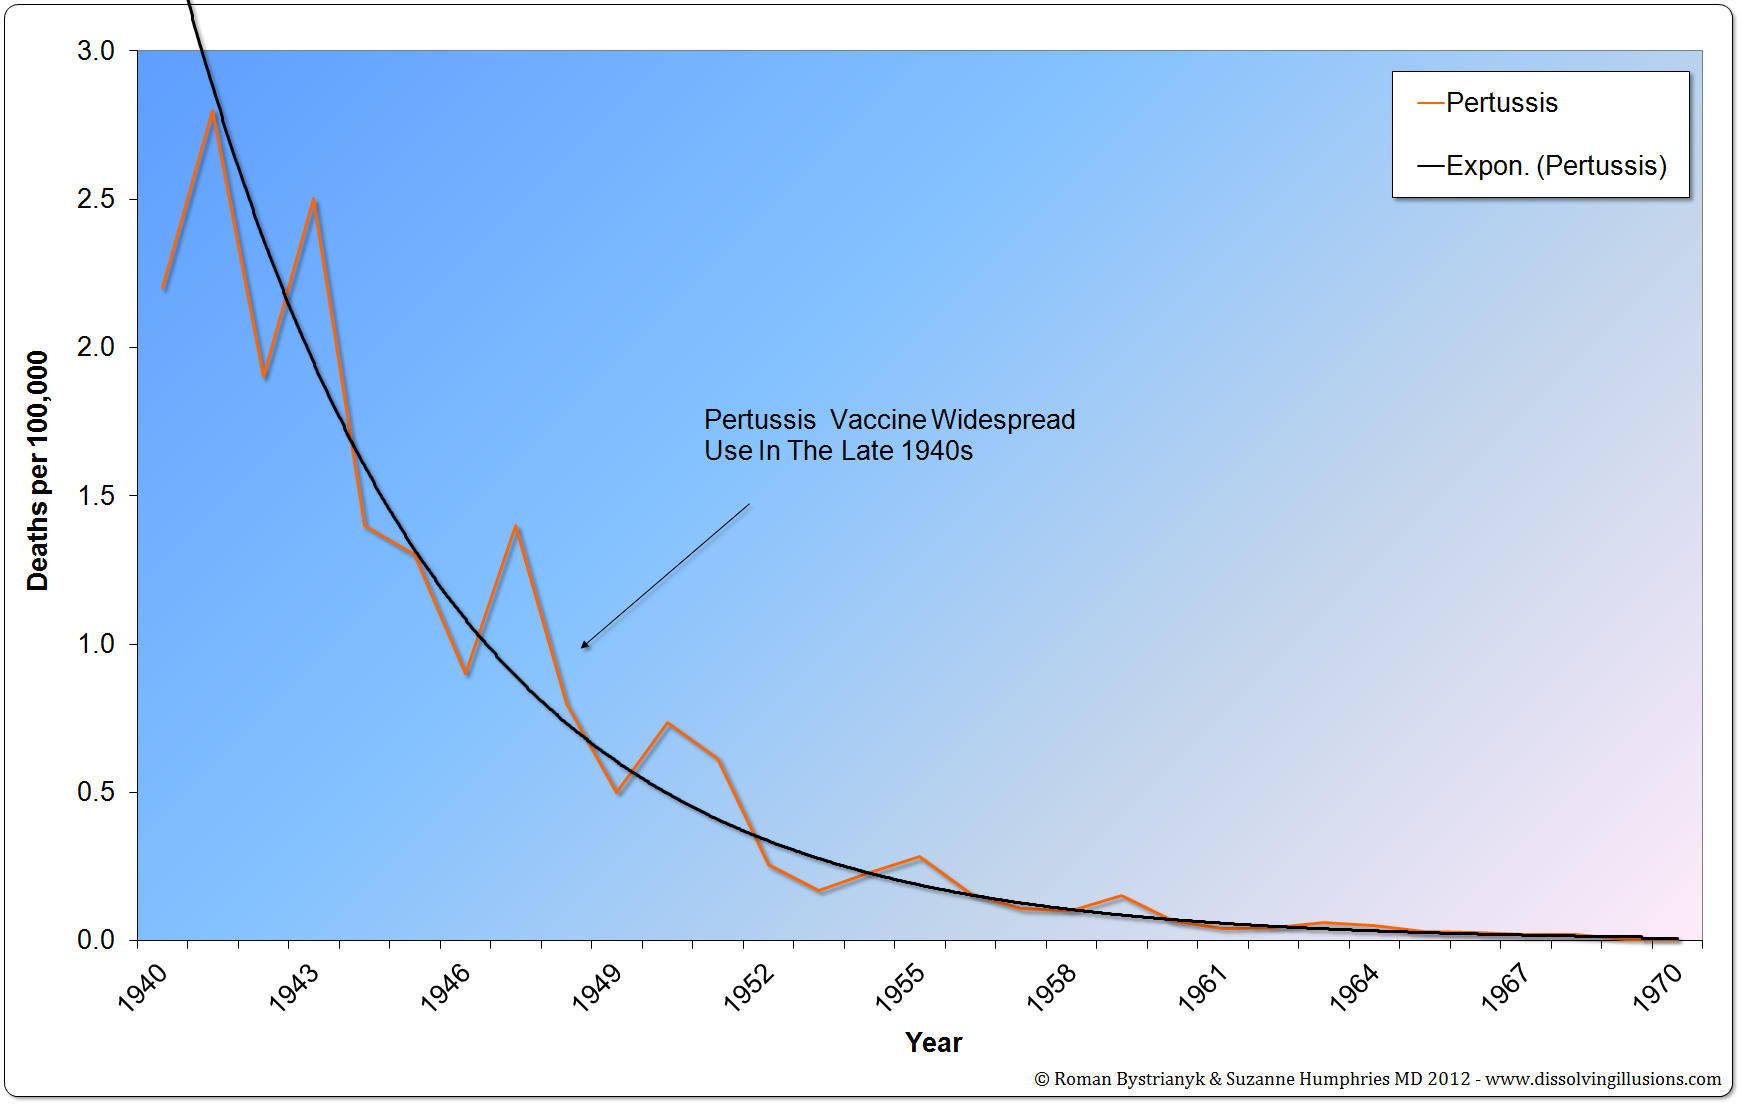
Graph 20.4: United States whooping cough mortality rate from 1940 to 1970. (Vital Statistics of the United States 1937, 1938, 1943, 1944, 1949, 1960, 1967, 1976, 1987, 1992; Historical Statistics of the United States—Colonial Times to 1970 Part 1; Health, United States, 2004, US Department of Health and Human Services; Vital Records & Health Data Development Section, Michigan Department of Community Health; US Census Bureau, Statistical Abstract of the United States: 2003; Reported Cases and Deaths from Vaccine Preventable Diseases, United States, 1950–2008) *First Edition: Graph 17.4
Graph 20.5: England and Wales whooping cough mortality from 1940 to 2008. (Record of Mortality in England and Wales for 95 years as provided by the office of National Statistics, 1997; Health Protection Agency Table: Notification of Deaths, England and Wales, 1970–2008) *First Edition: Graph 17.5
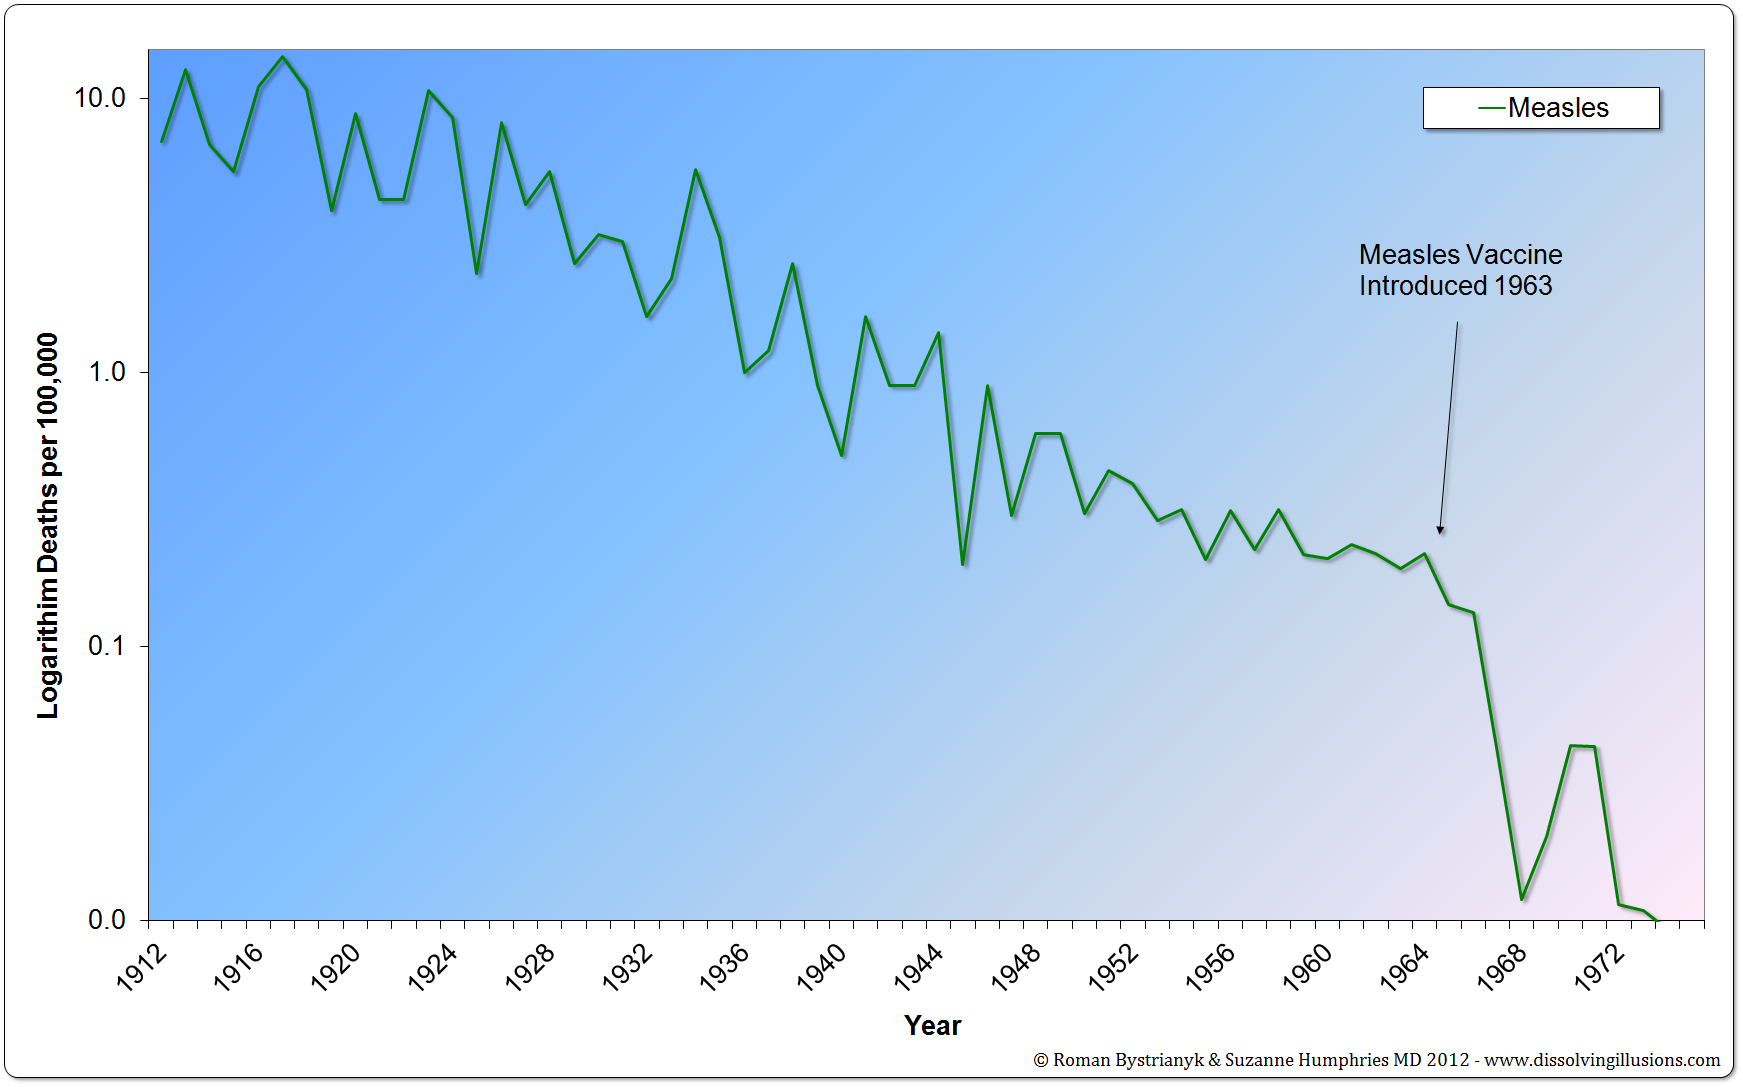
Graph 20.6: United States measles mortality rate from 1912 to 1975 on a logarithm plot. (Vital Statistics of the United States 1937, 1938, 1943, 1944, 1949, 1960, 1967, 1976, 1987, 1992; Historical Statistics of the United States—Colonial Times to 1970 Part 1; Health, United States, 2004, US Department of Health and Human Services; Vital Records & Health Data Development Section, Michigan Department of Community Health; US Census Bureau, Statistical Abstract of the United States: 2003; Reported Cases and Deaths from Vaccine Preventable Diseases, United States, 1950–2008) *First Edition: Graph 17.6
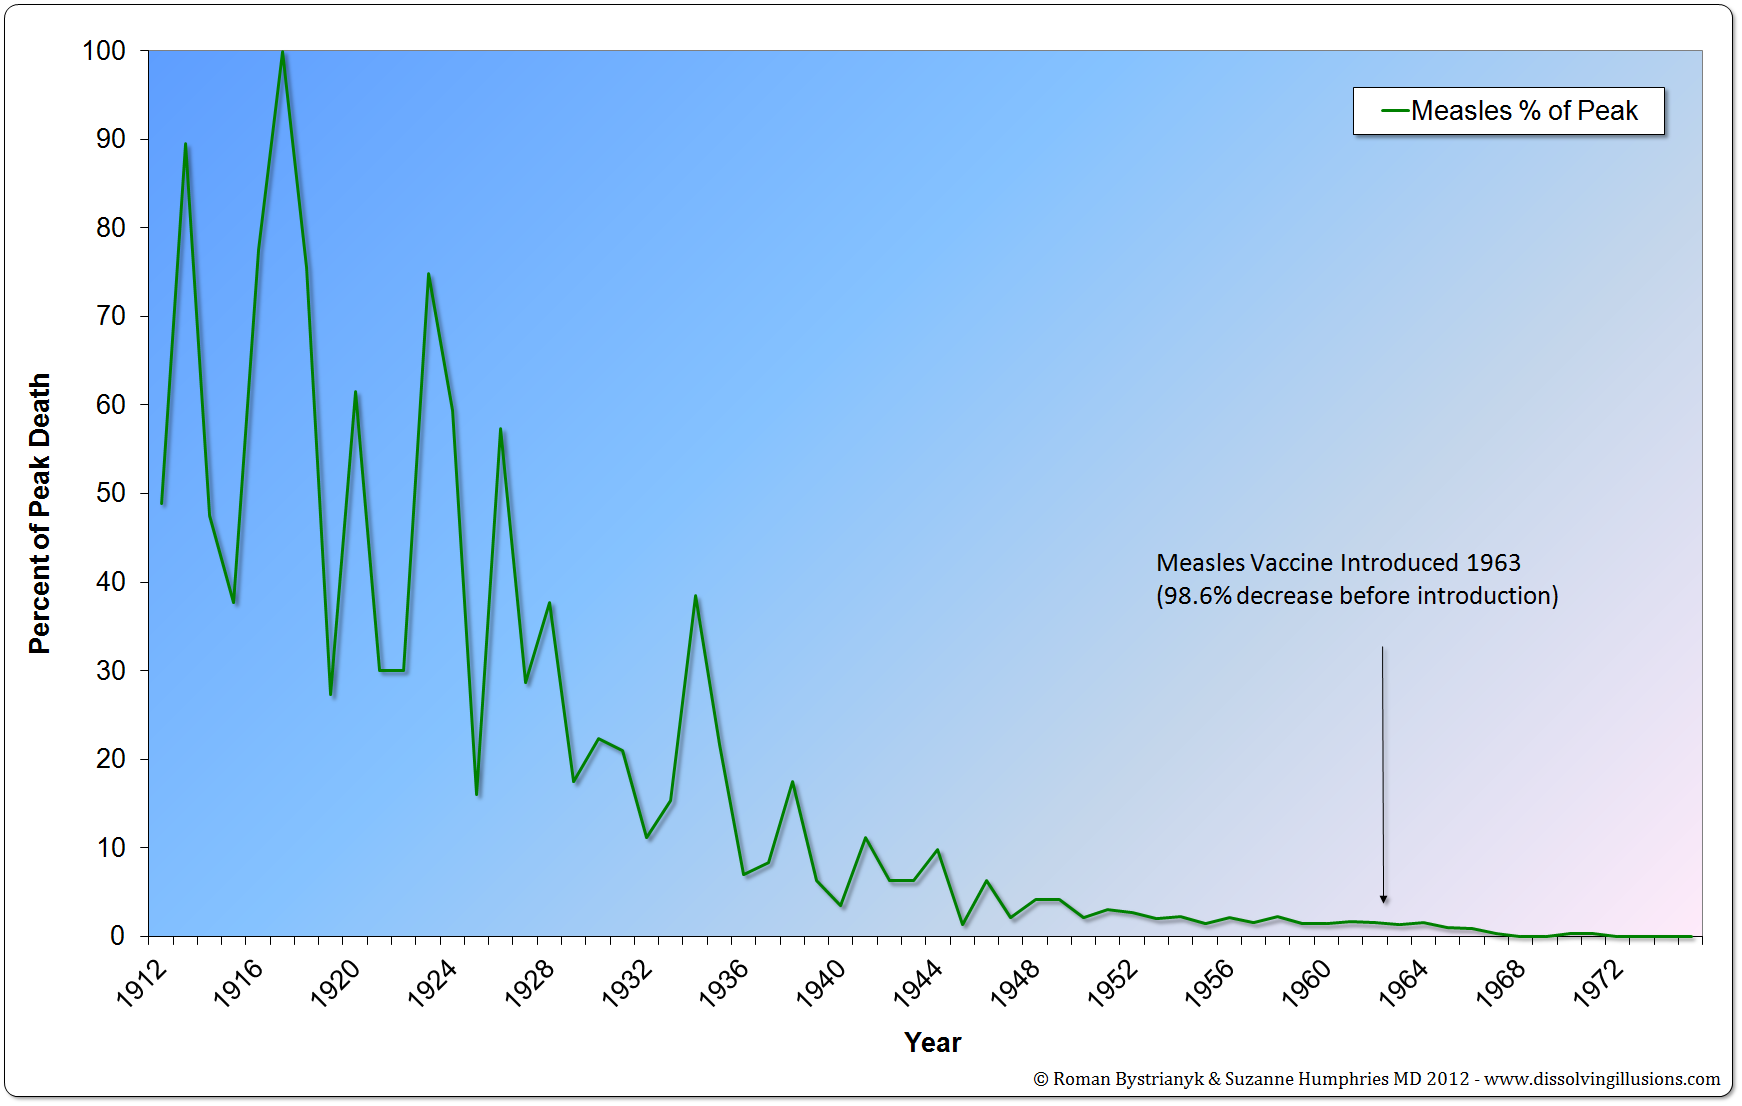
Graph 20.7: United States measles mortality rate from 1912 to 1975 in percent from the peak. (Vital Statistics of the United States 1937, 1938, 1943, 1944, 1949, 1960, 1967, 1976, 1987, 1992; Historical Statistics of the United States—Colonial Times to 1970 Part 1; Health, United States, 2004, US Department of Health and Human Services; Vital Records & Health Data Development Section, Michigan Department of Community Health; US Census Bureau, Statistical Abstract of the United States: 2003; Reported Cases and Deaths from Vaccine Preventable Diseases, United States, 1950–2008) *First Edition: Graph 17.7
Graph 20.8: United States measles mortality rate from 1930. (Vital Statistics of the United States 1937, 1938, 1943, 1944, 1949, 1960, 1967, 1976, 1987, 1992; Historical Statistics of the United States—Colonial Times to 1970 Part 1; Health, United States, 2004, US Department of Health and Human Services; Vital Records & Health Data Development Section, Michigan Department of Community Health; US Census Bureau, Statistical Abstract of the United States: 2003; Reported Cases and Deaths from Vaccine Preventable Diseases, United States, 1950–2008) *First Edition: Graph 17.8
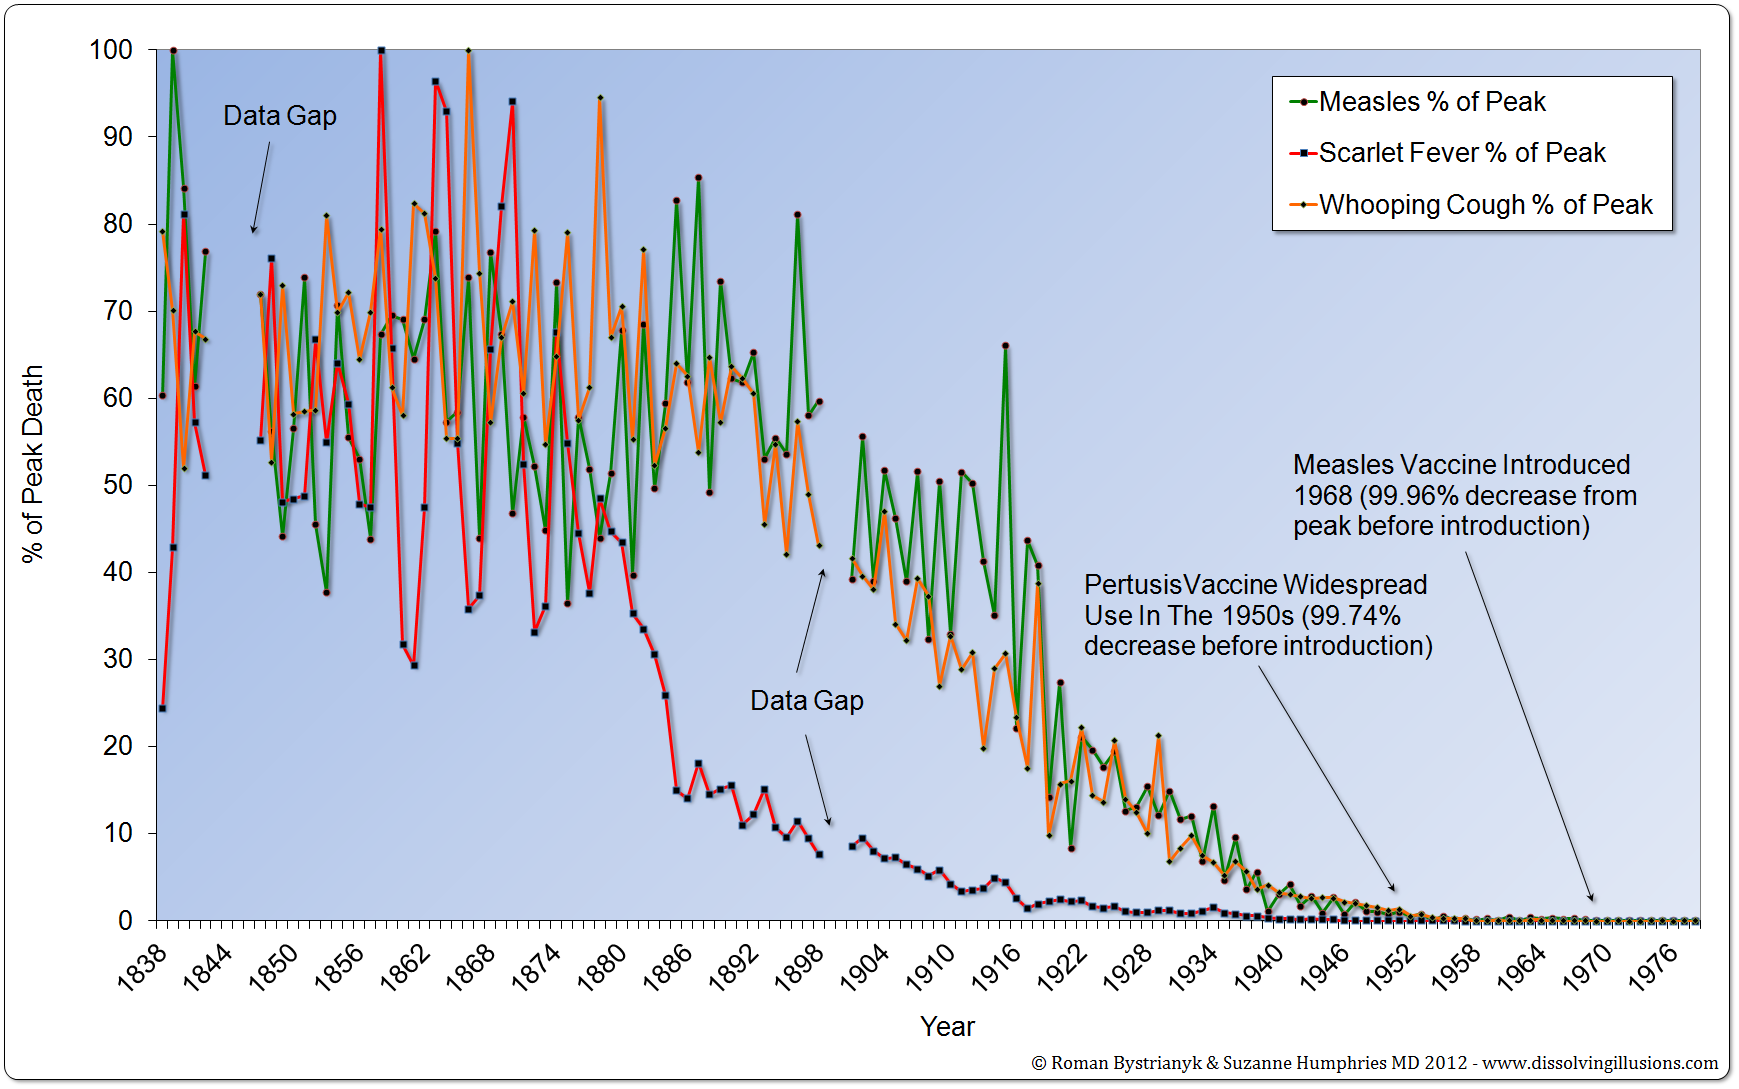
Graph 20.9: England and Wales scarlet fever, measles, and whooping cough mortality rates from 1838 to 1978 in percent from the peak. (Record of mortality in England and Wales for 95 years as provided by the Office of National Statistics, published 1997; Report to The Honourable Sir George Cornewall Lewis, Bart, MP, Her Majesty’s Principal Secretary of State for the Home Department, June 30, 1860, pp. a4, 205; Essay on Vaccination by Charles T. Pearce, MD, Member of the Royal College of Surgeons of England; Parliamentary Papers, the 62nd Annual Return of the Registrar General 1899 (1891–1898)) *First Edition: Graph 17.9
Graph 20.10: Leicester, England, mortality rates by age categories and smallpox vaccine coverage from 1838 to 1888. (Leicester: Sanitation Versus Vaccination, J. T. Biggs, JP, 1912, pp. 720–722) *First Edition: Graph 17.10
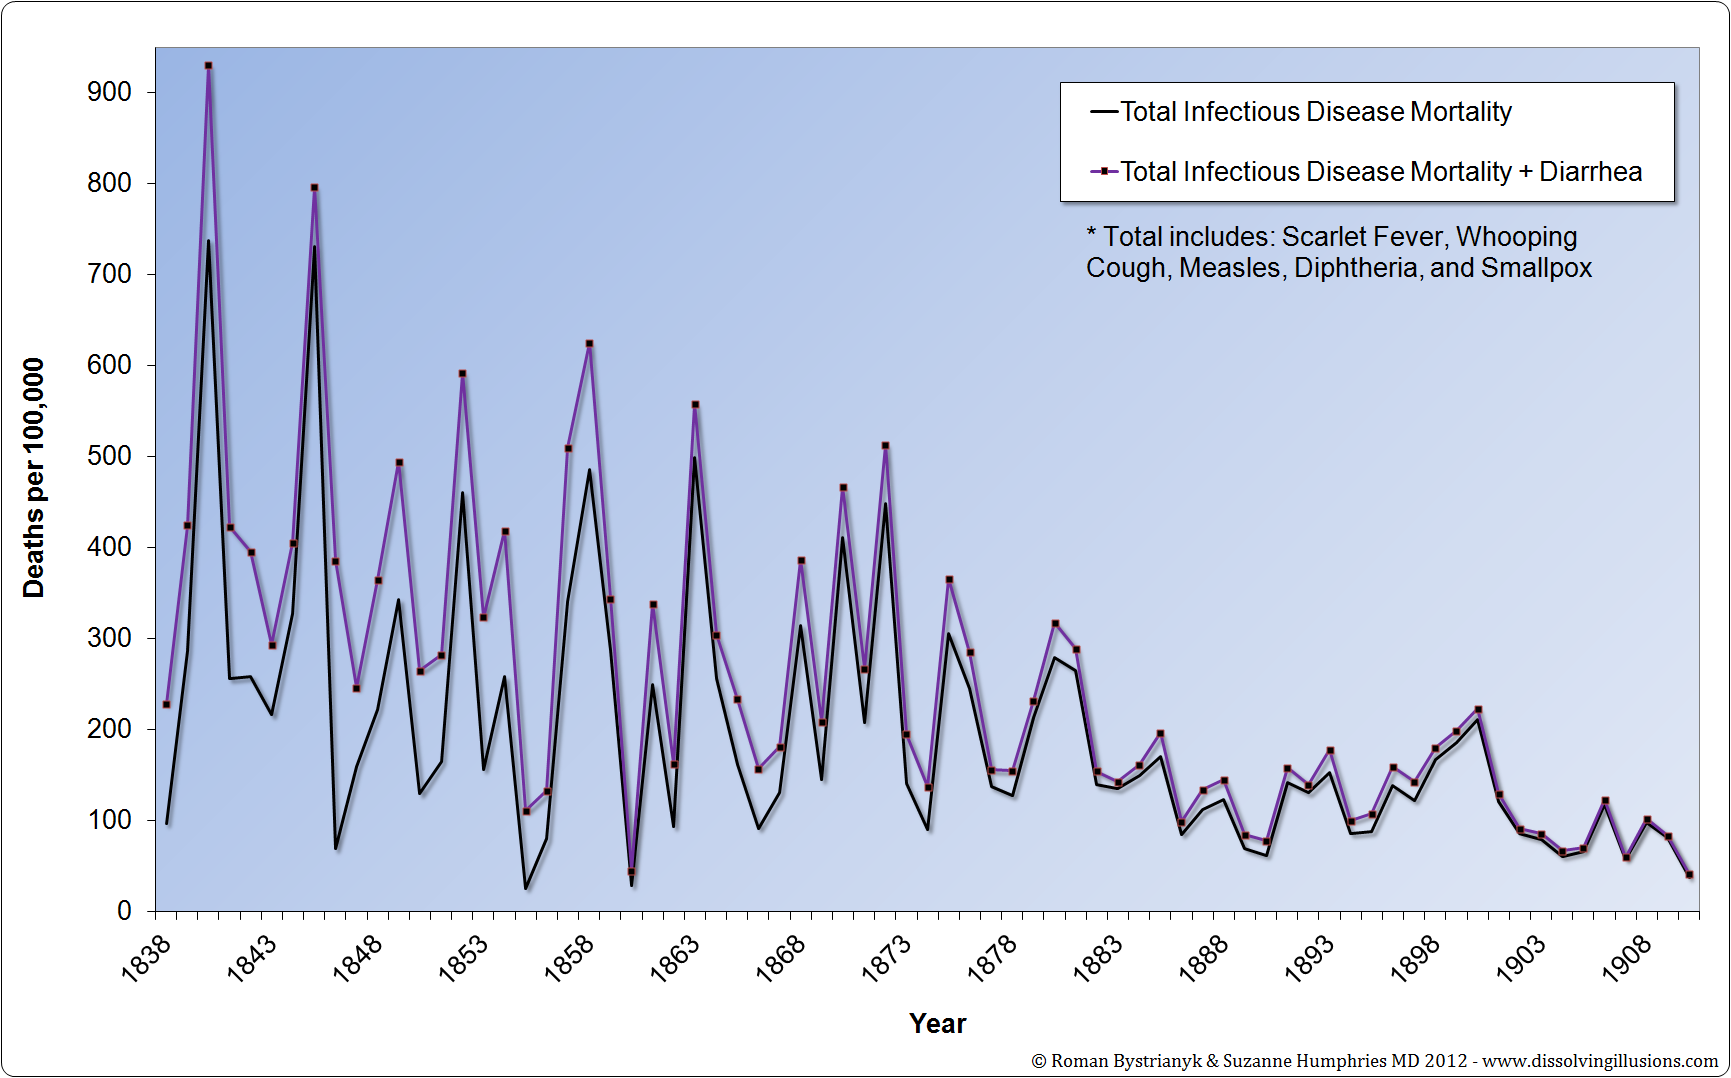
Graph 20.11: Leicester combined mortality rates from various infectious diseases and diarrhea from 1838 to 1910. (Leicester: Sanitation Versus Vaccination, J. T. Biggs, JP, 1912, pp. 720–722) *First Edition: Graph 17.11
Additional Charts
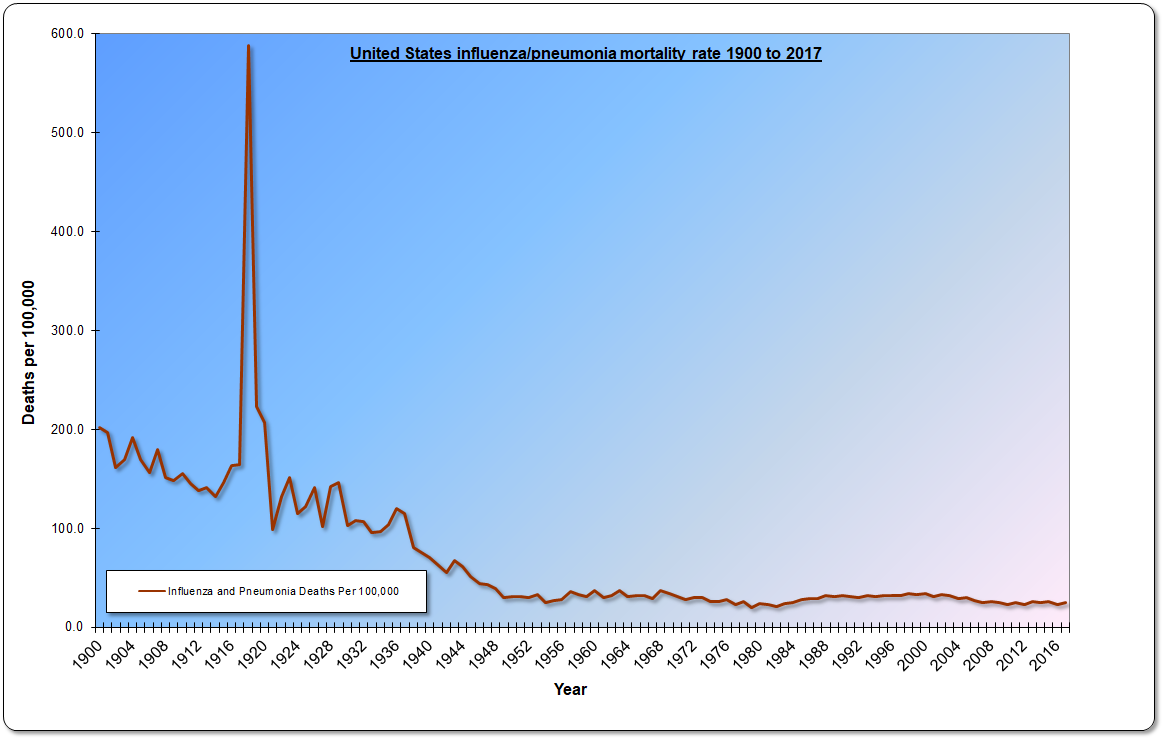
United States influenza/pneumonia mortality rate 1900 to 2017 (Chapter B, Vital Statistics and Health and Medical Care, Vital Statistics, B 149-166, p. 58: https://www2.census.gov/prod2/statcomp/documents/CT1970p1-03.pdf; Leading Causes of Death, 1900-1998: http://www.cdc.gov/nchs/data/dvs/lead1900_98.pdf; Vital Statistics of the United States 1992 Volume II – Mortality Part A, U.S. Department of Health and Human Services, 1996, p. 12; Leading Causes of Death, 1900-1998: http://www.cdc.gov/nchs/data/dvs/lead1900_98.pdf; National Vital Statistics Report, vol. 49, no. 8, September 21, 2001, Deaths: Final Data for 1999, p. 6: https://www.cdc.gov/nchs/data/nvsr/nvsr49/nvsr49_08.pdf; National Vital Statistics Report, vol. 50, no. 15, September 16, 2002, Deaths: Final Data for 2000, p. 8: https://www.cdc.gov/nchs/data/nvsr/nvsr50/nvsr50_15.pdf; National Vital Statistics Report, vol. 52, no. 4, September 18, 2003, Deaths: Final Data for 2001, p. 8: https://www.cdc.gov/nchs/data/nvsr/nvsr52/nvsr52_03.pdf; National Vital Statistics Report, vol. 53, no. 5, October 12, 2004, Deaths: Final Data for 2002, p. 5: https://www.cdc.gov/nchs/data/nvsr/nvsr53/nvsr53_05acc.pdf; National Vital Statistics Report, vol. 54, no. 13, April 19, 2006, Deaths: Final Data for 2003, p. 5: https://data.nber.org/perinatal/2003/Doc/2003_Mortality_Final_Data.pdf; National Vital Statistics Report, vol. 55, no. 19, August 21, 2007, Deaths: Final Data for 2003, p. 8: https://www.cdc.gov/nchs/data/nvsr/nvsr55/nvsr55_19.pdf; National Vital Statistics Report, vol. 56, no. 10, April 24, 2008, Deaths: Final Data for 2005, p. 5: https://www.cdc.gov/nchs/data/nvsr/nvsr56/nvsr56_10.pdf; National Vital Statistics Report, vol. 57, no. 14, April 17, 2009, Deaths: Final Data for 2006, p. 5: https://www.cdc.gov/nchs/data/nvsr/nvsr57/nvsr57_14.pdf; National Vital Statistics Report, vol. 58, no. 19, May 20, 2010, Deaths: Final Data for 2007, p. 5: https://www.cdc.gov/nchs/data/nvsr/nvsr58/nvsr58_19.pdf; National Vital Statistics Report, vol. 59, no. 10, December 7, 2011, Deaths: Final Data for 2008, p. 5: https://www.cdc.gov/nchs/data/nvsr/nvsr59/nvsr59_10.pdf; National Vital Statistics Report, vol. 60, no. 3, December 29, 2011, Deaths: Final Data for 2009, p. 5: https://www.cdc.gov/nchs/data/nvsr/nvsr60/nvsr60_03.pdf; National Vital Statistics Report, vol. 61, no. 4, May 8, 2013, Deaths: Final Data for 2010, p. 5: https://www.cdc.gov/nchs/data/nvsr/nvsr61/nvsr61_04.pdf; National Vital Statistics Report, vol. 63, no. 3, July 27, 2015, Deaths: Final Data for 2011, p. 5: https://www.cdc.gov/nchs/data/nvsr/nvsr63/nvsr63_03.pdf; National Vital Statistics Report, vol. 63, no. 9, August 31, 2015, Deaths: Final Data for 2012, p. 5: https://www.cdc.gov/nchs/data/nvsr/nvsr63/nvsr63_09.pdf; National Vital Statistics Report, vol. 64, no. 2, February 16, 2016, Deaths: Final Data for 2013, p. 5: https://www.cdc.gov/nchs/data/nvsr/nvsr64/nvsr64_02.pdf; National Vital Statistics Report, vol. 65, no. 4, June 30, 2016, Deaths: Final Data for 2014, p. 5: https://www.cdc.gov/nchs/data/nvsr/nvsr65/nvsr65_04.pdf; National Vital Statistics Report, vol. 66, no. 6, November 27, 2017, Deaths: Final Data for 2015, p. 6: https://www.cdc.gov/nchs/data/nvsr/nvsr66/nvsr66_06.pdf; National Vital Statistics Report, vol. 67, no. 5, July 26, 2018, Deaths: Final Data for 2016, p. 6: https://www.cdc.gov/nchs/data/nvsr/nvsr67/nvsr67_05.pdf; National Vital Statistics Report, vol. 68, no. 9, June 24, 2019, Deaths: Final Data for 2017, p. 6: https://www.cdc.gov/nchs/data/nvsr/nvsr68/nvsr68_09-508.pdf)
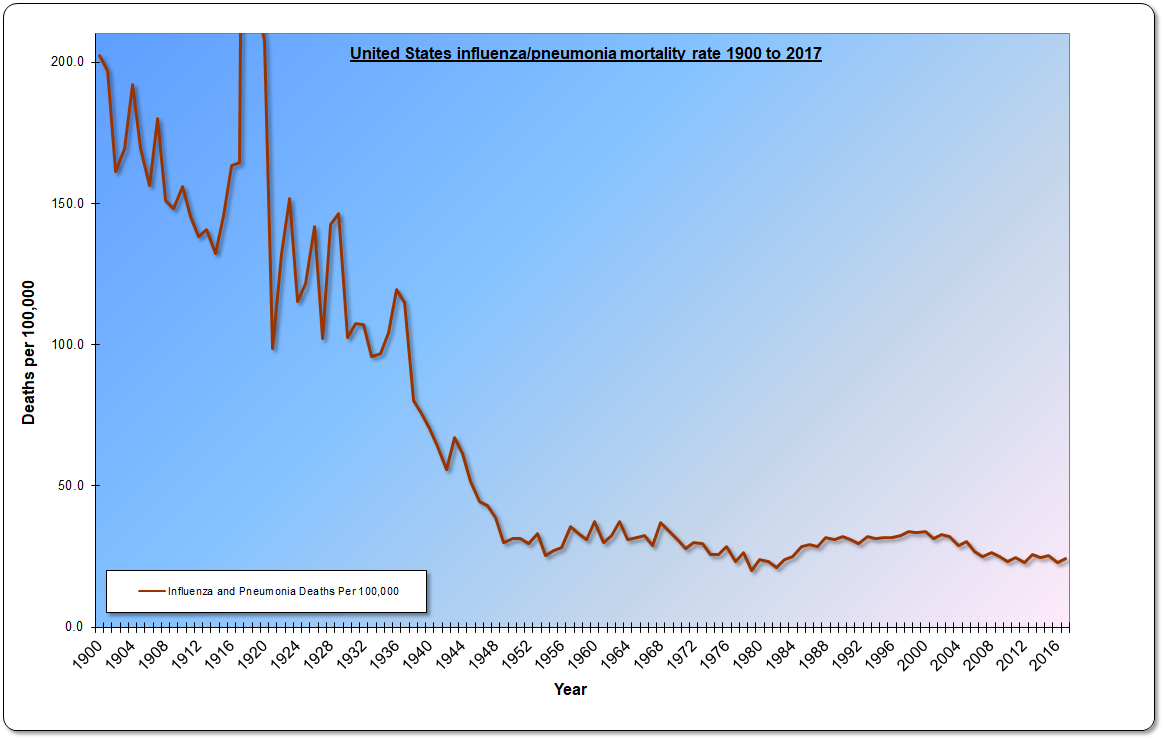
United States influenza/pneumonia mortality rate 1900 to 2017 – Magnified (Chapter B, Vital Statistics and Health and Medical Care, Vital Statistics, B 149-166, p. 58: https://www2.census.gov/prod2/statcomp/documents/CT1970p1-03.pdf; Leading Causes of Death, 1900-1998: http://www.cdc.gov/nchs/data/dvs/lead1900_98.pdf; Vital Statistics of the United States 1992 Volume II – Mortality Part A, U.S. Department of Health and Human Services, 1996, p. 12; Leading Causes of Death, 1900-1998: http://www.cdc.gov/nchs/data/dvs/lead1900_98.pdf; National Vital Statistics Report, vol. 49, no. 8, September 21, 2001, Deaths: Final Data for 1999, p. 6: https://www.cdc.gov/nchs/data/nvsr/nvsr49/nvsr49_08.pdf; National Vital Statistics Report, vol. 50, no. 15, September 16, 2002, Deaths: Final Data for 2000, p. 8: https://www.cdc.gov/nchs/data/nvsr/nvsr50/nvsr50_15.pdf; National Vital Statistics Report, vol. 52, no. 4, September 18, 2003, Deaths: Final Data for 2001, p. 8: https://www.cdc.gov/nchs/data/nvsr/nvsr52/nvsr52_03.pdf; National Vital Statistics Report, vol. 53, no. 5, October 12, 2004, Deaths: Final Data for 2002, p. 5: https://www.cdc.gov/nchs/data/nvsr/nvsr53/nvsr53_05acc.pdf; National Vital Statistics Report, vol. 54, no. 13, April 19, 2006, Deaths: Final Data for 2003, p. 5: https://data.nber.org/perinatal/2003/Doc/2003_Mortality_Final_Data.pdf; National Vital Statistics Report, vol. 55, no. 19, August 21, 2007, Deaths: Final Data for 2003, p. 8: https://www.cdc.gov/nchs/data/nvsr/nvsr55/nvsr55_19.pdf; National Vital Statistics Report, vol. 56, no. 10, April 24, 2008, Deaths: Final Data for 2005, p. 5: https://www.cdc.gov/nchs/data/nvsr/nvsr56/nvsr56_10.pdf; National Vital Statistics Report, vol. 57, no. 14, April 17, 2009, Deaths: Final Data for 2006, p. 5: https://www.cdc.gov/nchs/data/nvsr/nvsr57/nvsr57_14.pdf; National Vital Statistics Report, vol. 58, no. 19, May 20, 2010, Deaths: Final Data for 2007, p. 5: https://www.cdc.gov/nchs/data/nvsr/nvsr58/nvsr58_19.pdf; National Vital Statistics Report, vol. 59, no. 10, December 7, 2011, Deaths: Final Data for 2008, p. 5: https://www.cdc.gov/nchs/data/nvsr/nvsr59/nvsr59_10.pdf; National Vital Statistics Report, vol. 60, no. 3, December 29, 2011, Deaths: Final Data for 2009, p. 5: https://www.cdc.gov/nchs/data/nvsr/nvsr60/nvsr60_03.pdf; National Vital Statistics Report, vol. 61, no. 4, May 8, 2013, Deaths: Final Data for 2010, p. 5: https://www.cdc.gov/nchs/data/nvsr/nvsr61/nvsr61_04.pdf; National Vital Statistics Report, vol. 63, no. 3, July 27, 2015, Deaths: Final Data for 2011, p. 5: https://www.cdc.gov/nchs/data/nvsr/nvsr63/nvsr63_03.pdf; National Vital Statistics Report, vol. 63, no. 9, August 31, 2015, Deaths: Final Data for 2012, p. 5: https://www.cdc.gov/nchs/data/nvsr/nvsr63/nvsr63_09.pdf; National Vital Statistics Report, vol. 64, no. 2, February 16, 2016, Deaths: Final Data for 2013, p. 5: https://www.cdc.gov/nchs/data/nvsr/nvsr64/nvsr64_02.pdf; National Vital Statistics Report, vol. 65, no. 4, June 30, 2016, Deaths: Final Data for 2014, p. 5: https://www.cdc.gov/nchs/data/nvsr/nvsr65/nvsr65_04.pdf; National Vital Statistics Report, vol. 66, no. 6, November 27, 2017, Deaths: Final Data for 2015, p. 6: https://www.cdc.gov/nchs/data/nvsr/nvsr66/nvsr66_06.pdf; National Vital Statistics Report, vol. 67, no. 5, July 26, 2018, Deaths: Final Data for 2016, p. 6: https://www.cdc.gov/nchs/data/nvsr/nvsr67/nvsr67_05.pdf; National Vital Statistics Report, vol. 68, no. 9, June 24, 2019, Deaths: Final Data for 2017, p. 6: https://www.cdc.gov/nchs/data/nvsr/nvsr68/nvsr68_09-508.pdf)
United States influenza/pneumonia mortality rate and influenza vaccine coverage 1960 to 2017 (Chapter B, Vital Statistics and Health and Medical Care, Vital Statistics, B 149-166, p. 58: https://www2.census.gov/prod2/statcomp/documents/CT1970p1-03.pdf; Leading Causes of Death, 1900-1998: http://www.cdc.gov/nchs/data/dvs/lead1900_98.pdf; Vital Statistics of the United States 1992 Volume II – Mortality Part A, U.S. Department of Health and Human Services, 1996, p. 12; Leading Causes of Death, 1900-1998: http://www.cdc.gov/nchs/data/dvs/lead1900_98.pdf; National Vital Statistics Report, vol. 49, no. 8, September 21, 2001, Deaths: Final Data for 1999, p. 6: https://www.cdc.gov/nchs/data/nvsr/nvsr49/nvsr49_08.pdf; National Vital Statistics Report, vol. 50, no. 15, September 16, 2002, Deaths: Final Data for 2000, p. 8: https://www.cdc.gov/nchs/data/nvsr/nvsr50/nvsr50_15.pdf; National Vital Statistics Report, vol. 52, no. 4, September 18, 2003, Deaths: Final Data for 2001, p. 8: https://www.cdc.gov/nchs/data/nvsr/nvsr52/nvsr52_03.pdf; National Vital Statistics Report, vol. 53, no. 5, October 12, 2004, Deaths: Final Data for 2002, p. 5: https://www.cdc.gov/nchs/data/nvsr/nvsr53/nvsr53_05acc.pdf; National Vital Statistics Report, vol. 54, no. 13, April 19, 2006, Deaths: Final Data for 2003, p. 5: https://data.nber.org/perinatal/2003/Doc/2003_Mortality_Final_Data.pdf; National Vital Statistics Report, vol. 55, no. 19, August 21, 2007, Deaths: Final Data for 2003, p. 8: https://www.cdc.gov/nchs/data/nvsr/nvsr55/nvsr55_19.pdf; National Vital Statistics Report, vol. 56, no. 10, April 24, 2008, Deaths: Final Data for 2005, p. 5: https://www.cdc.gov/nchs/data/nvsr/nvsr56/nvsr56_10.pdf; National Vital Statistics Report, vol. 57, no. 14, April 17, 2009, Deaths: Final Data for 2006, p. 5: https://www.cdc.gov/nchs/data/nvsr/nvsr57/nvsr57_14.pdf; National Vital Statistics Report, vol. 58, no. 19, May 20, 2010, Deaths: Final Data for 2007, p. 5: https://www.cdc.gov/nchs/data/nvsr/nvsr58/nvsr58_19.pdf; National Vital Statistics Report, vol. 59, no. 10, December 7, 2011, Deaths: Final Data for 2008, p. 5: https://www.cdc.gov/nchs/data/nvsr/nvsr59/nvsr59_10.pdf; National Vital Statistics Report, vol. 60, no. 3, December 29, 2011, Deaths: Final Data for 2009, p. 5: https://www.cdc.gov/nchs/data/nvsr/nvsr60/nvsr60_03.pdf; National Vital Statistics Report, vol. 61, no. 4, May 8, 2013, Deaths: Final Data for 2010, p. 5: https://www.cdc.gov/nchs/data/nvsr/nvsr61/nvsr61_04.pdf; National Vital Statistics Report, vol. 63, no. 3, July 27, 2015, Deaths: Final Data for 2011, p. 5: https://www.cdc.gov/nchs/data/nvsr/nvsr63/nvsr63_03.pdf; National Vital Statistics Report, vol. 63, no. 9, August 31, 2015, Deaths: Final Data for 2012, p. 5: https://www.cdc.gov/nchs/data/nvsr/nvsr63/nvsr63_09.pdf; National Vital Statistics Report, vol. 64, no. 2, February 16, 2016, Deaths: Final Data for 2013, p. 5: https://www.cdc.gov/nchs/data/nvsr/nvsr64/nvsr64_02.pdf; National Vital Statistics Report, vol. 65, no. 4, June 30, 2016, Deaths: Final Data for 2014, p. 5: https://www.cdc.gov/nchs/data/nvsr/nvsr65/nvsr65_04.pdf; National Vital Statistics Report, vol. 66, no. 6, November 27, 2017, Deaths: Final Data for 2015, p. 6: https://www.cdc.gov/nchs/data/nvsr/nvsr66/nvsr66_06.pdf; National Vital Statistics Report, vol. 67, no. 5, July 26, 2018, Deaths: Final Data for 2016, p. 6: https://www.cdc.gov/nchs/data/nvsr/nvsr67/nvsr67_05.pdf; National Vital Statistics Report, vol. 68, no. 9, June 24, 2019, Deaths: Final Data for 2017, p. 6: https://www.cdc.gov/nchs/data/nvsr/nvsr68/nvsr68_09-508.pdf; Impact of Influenza Vaccination on Seasonal Mortality in the US Eldery Population, Acrhives of Internal Medicine, Vol. 165, February 14, 2005: https://jamanetwork.com/journals/jamainternalmedicine/fullarticle/10.1001/archinte.165.3.265; Public Health and Aging: Influenza Vaccination Coverage Among Adults Aged >50 Years and Pneumococcal Vaccination Coverage Among Adults Aged >65 Years — United States, 2002: https://www.cdc.gov/mmwr/preview/mmwrhtml/mm5241a3.htm; Influenza Vaccination Levels Among Persons Aged >65 Years and Among Persons Aged 18–64 Years with High-Risk Conditions — United States, 2003: https://www.cdc.gov/mmwr/preview/mmwrhtml/mm5441a3.htm; Influenza and Pneumococcal Vaccination Coverage Among Persons Aged >65 Years — United States, 2004–2005: https://www.cdc.gov/mmwr/preview/mmwrhtml/mm5539a2.htm; State-Specific Influenza Vaccination Coverage Among Adults Aged >18 Years — United States, 2003–04 and 2005–06 Influenza Season: https://www.cdc.gov/mmwr/preview/mmwrhtml/mm5637a1.htm; State-Specific Influenza Vaccination Coverage Among Adults — United States, 2006–07 Influenza Season: https://www.cdc.gov/mmwr/preview/mmwrhtml/mm5738a1.htm; Influenza Vaccination Coverage Among Children and Adults — United States, 2008–09 Influenza Season: https://www.cdc.gov/mmwr/preview/mmwrhtml/mm5839a1.htm; Final estimates for 2009–10 Seasonal Influenza and Influenza A (H1N1) 2009 Monovalent Vaccination Coverage – United States, August 2009 through May, 2010: https://www.cdc.gov/flu/fluvaxview/coverage_0910estimates.htm; Flu Vaccination Coverage, United States, 2019–20 Influenza Season: https://www.cdc.gov/flu/fluvaxview/coverage-1920estimates.htm)
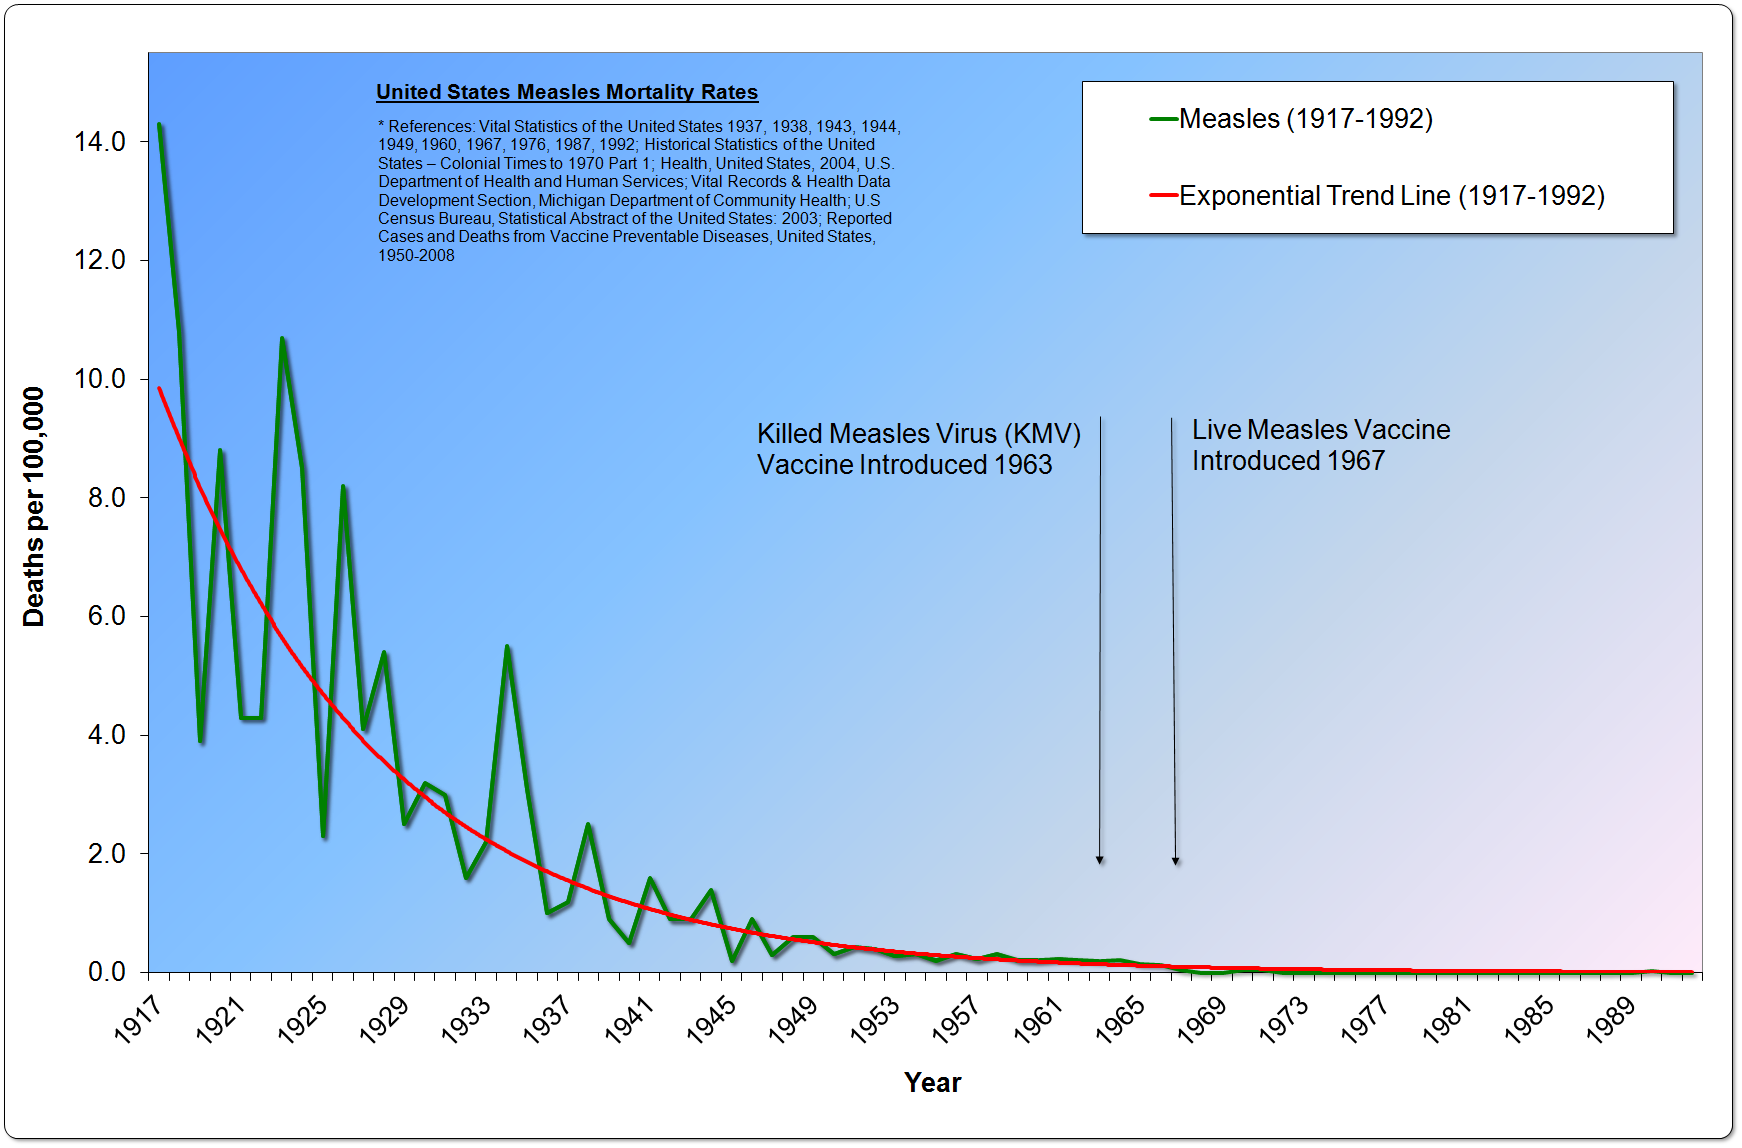
United States Measles Mortality Rates With Trend Line 1917-1992 (Vital Statistics of the United States 1937, 1938, 1943, 1944, 1949, 1960, 1967, 1976, 1987, 1992; Historical Statistics of the United States – Colonial Times to 1970 Part 1; Health, United States, 2004, U.S. Department of Health and Human Services; Vital Records & Health Data Development Section, Michigan Department of Community Health; U.S Census Bureau, Statistical Abstract of the United States: 2003; Reported Cases and Deaths from Vaccine Preventable Diseases, United States, 1950-2008)
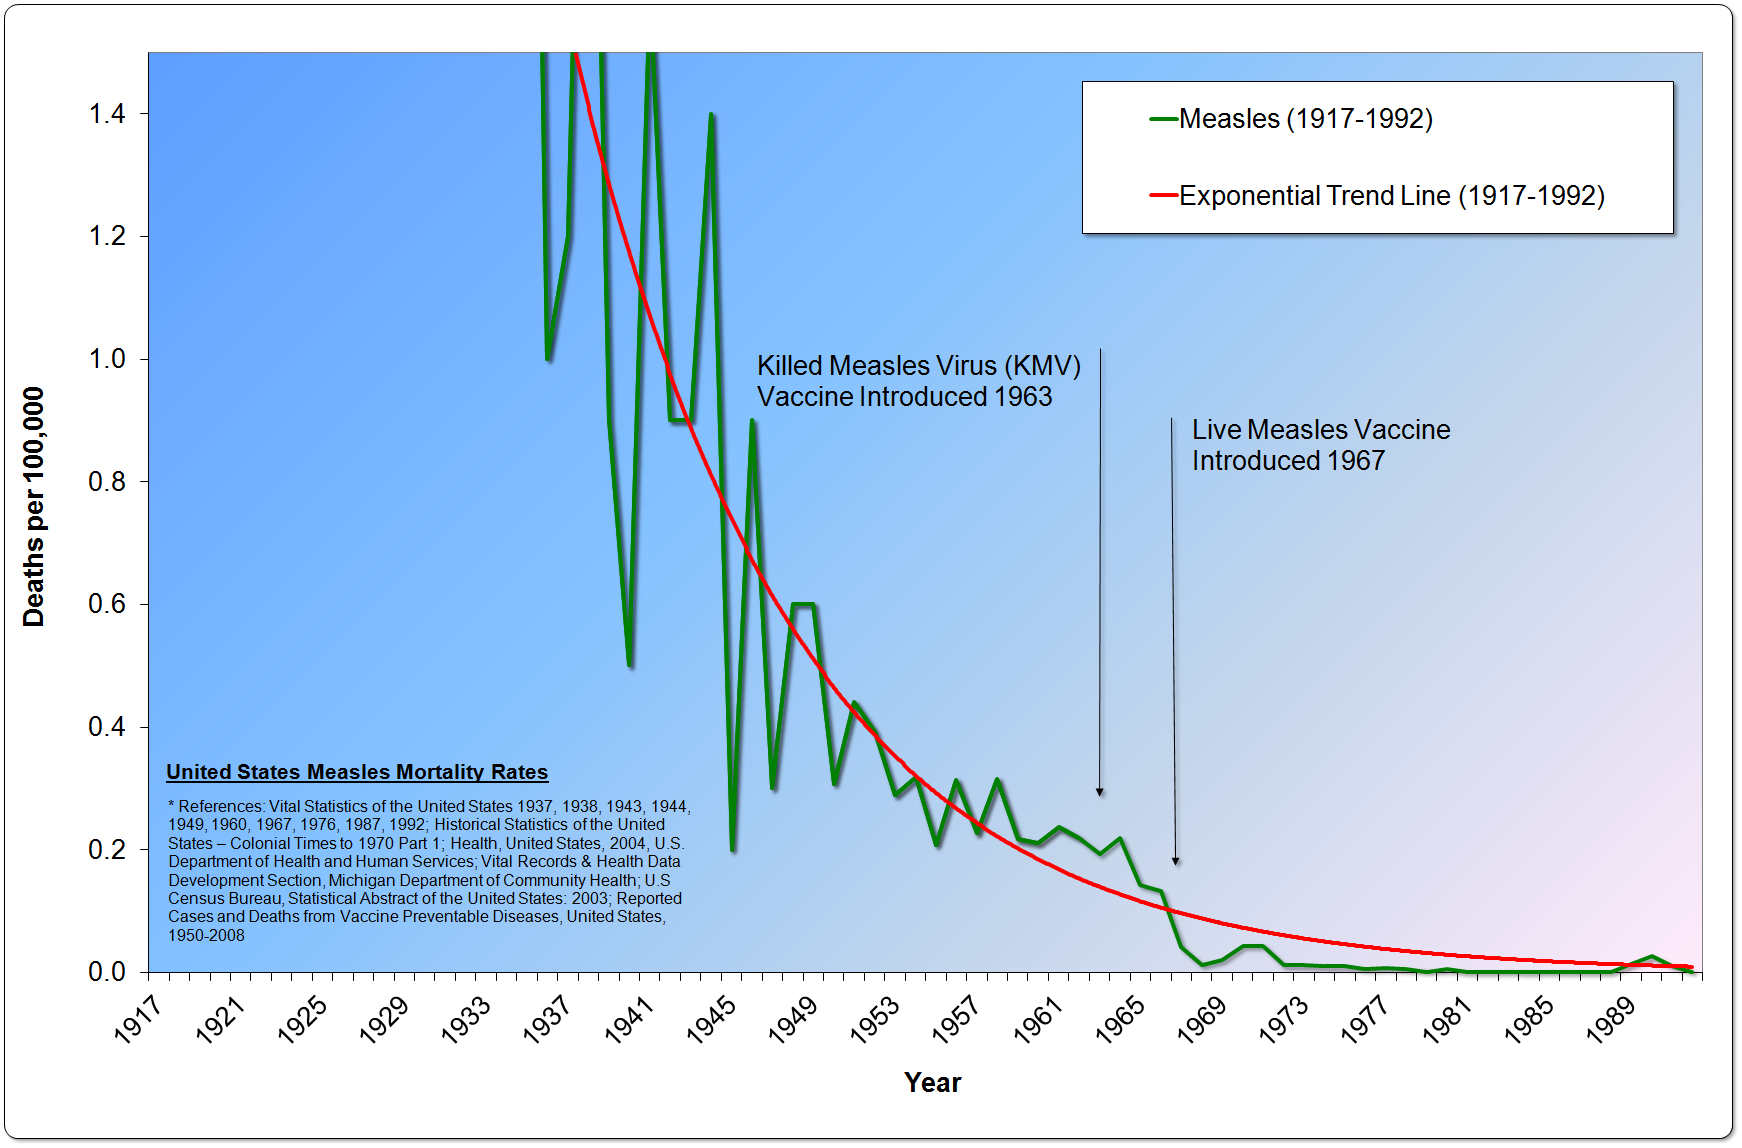
United States Measles Mortality Rates With Trend Line 1917-1992 – Magnified (Vital Statistics of the United States 1937, 1938, 1943, 1944, 1949, 1960, 1967, 1976, 1987, 1992; Historical Statistics of the United States – Colonial Times to 1970 Part 1; Health, United States, 2004, U.S. Department of Health and Human Services; Vital Records & Health Data Development Section, Michigan Department of Community Health; U.S Census Bureau, Statistical Abstract of the United States: 2003; Reported Cases and Deaths from Vaccine Preventable Diseases, United States, 1950-2008)
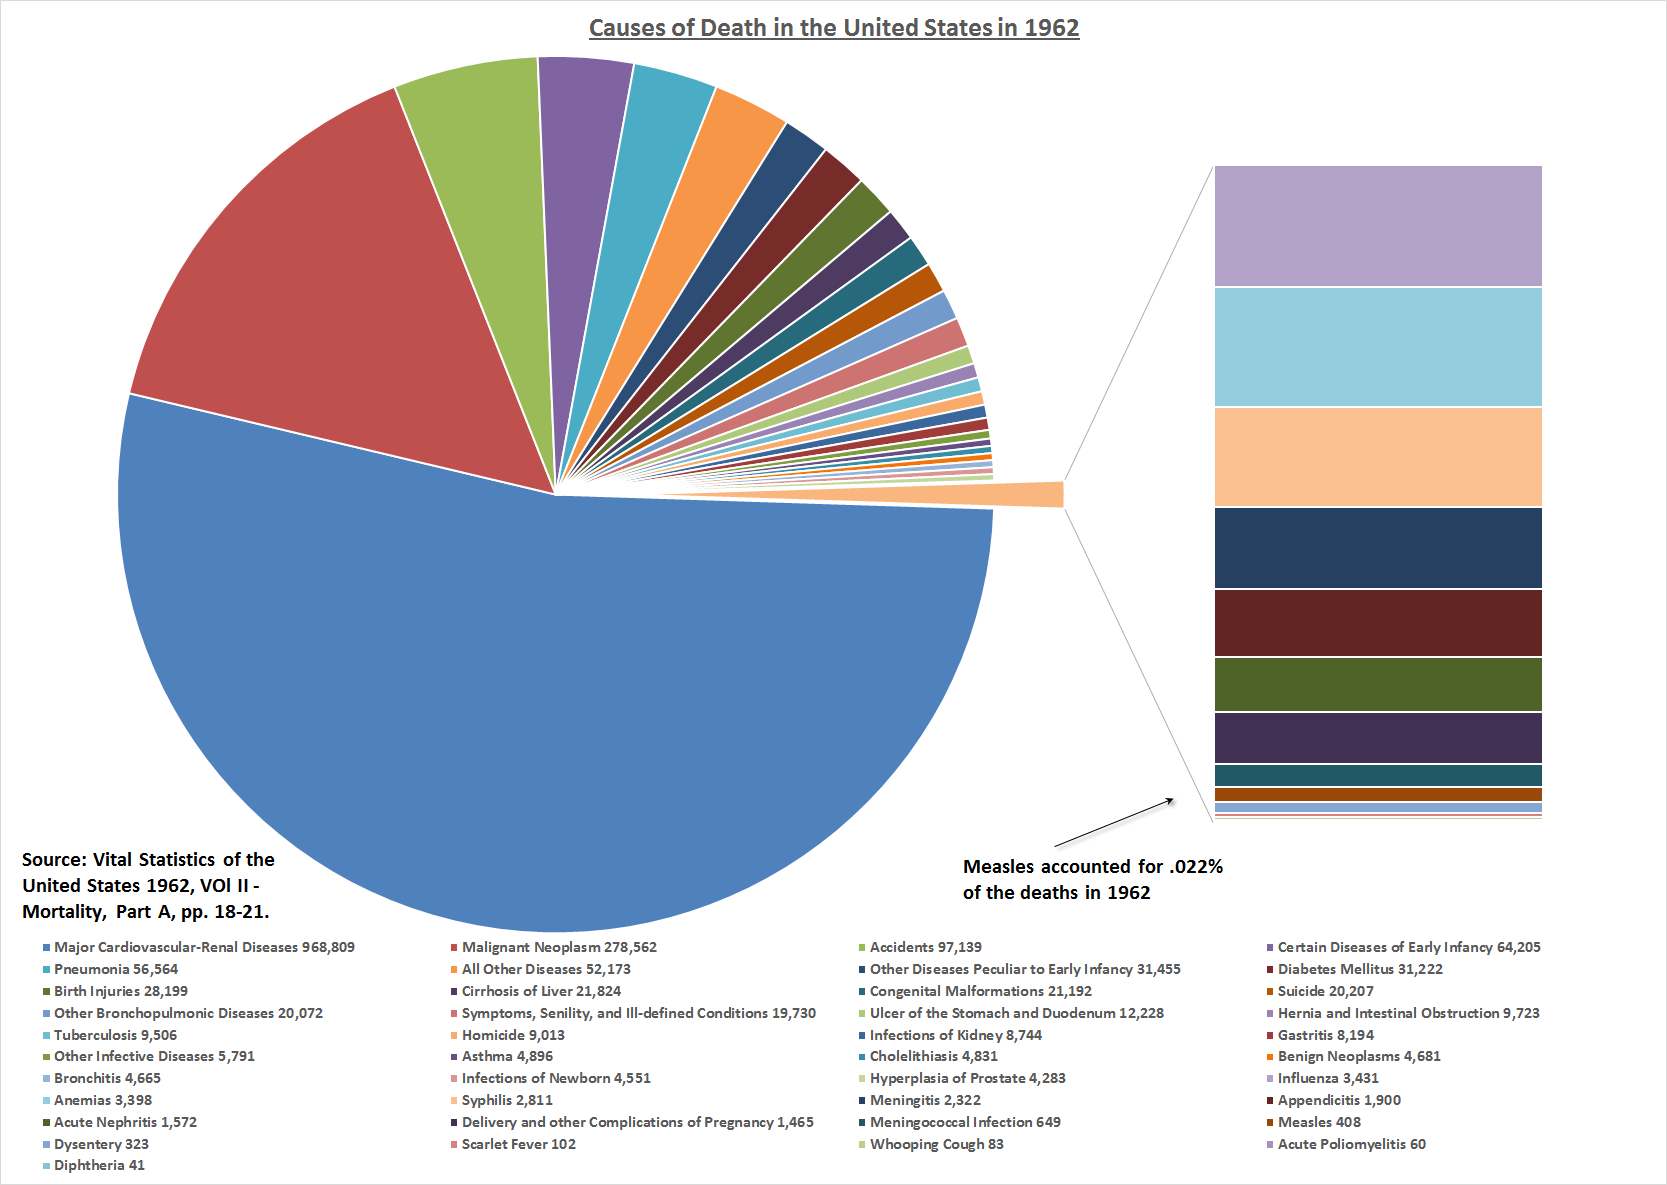
Causes of Death in the United States in 1962 (Vital Statistics of the United States, Vol II – Mortality, Part A, pp. 18-21.)
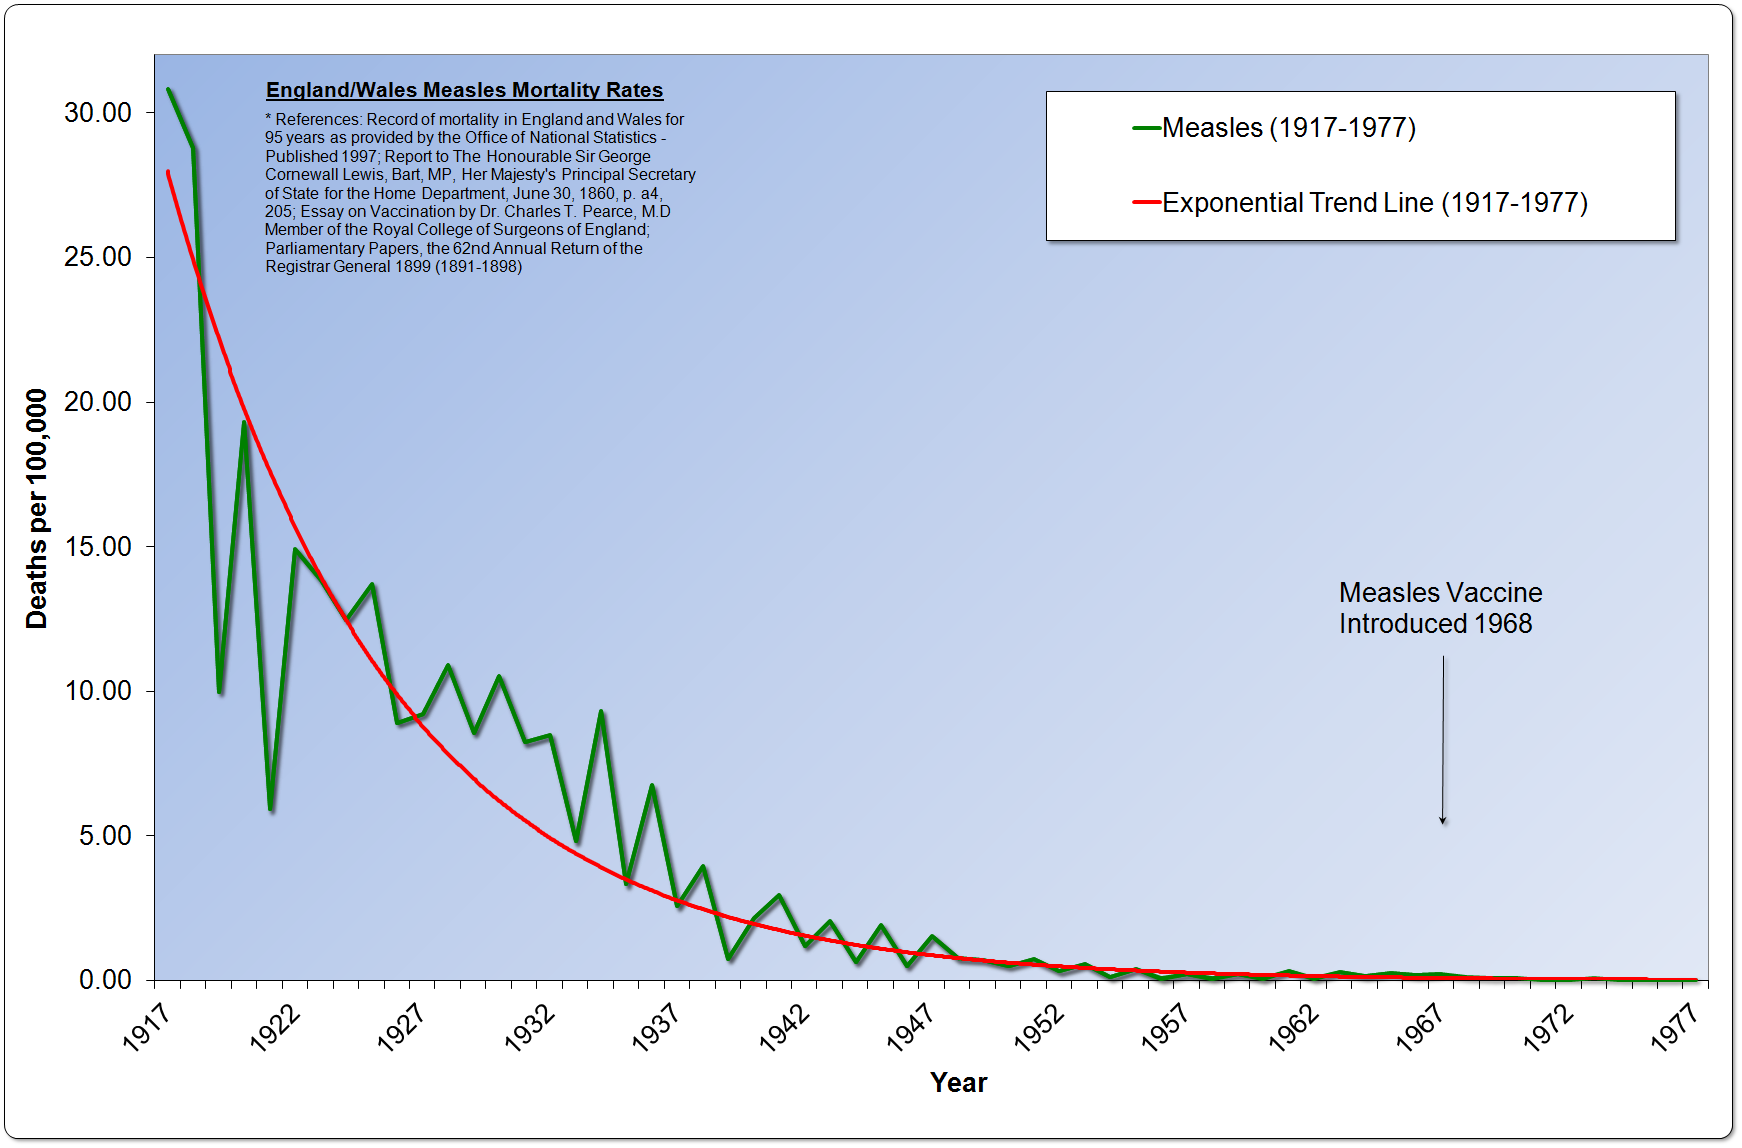
England/Wales Measles Mortality Rates With Trend Line 1917-1977 (Record of mortality in England and Wales for 95 years as provided by the Office of National Statistics – Published 1997; Report to The Honourable Sir George Cornewall Lewis, Bart, MP, Her Majesty’s Principal Secretary of State for the Home Department, June 30, 1860, p. a4, 205; Essay on Vaccination by Dr. Charles T. Pearce, M.D Member of the Royal College of Surgeons of England; Parliamentary Papers, the 62nd Annual Return of the Registrar General 1899 (1891-1898))
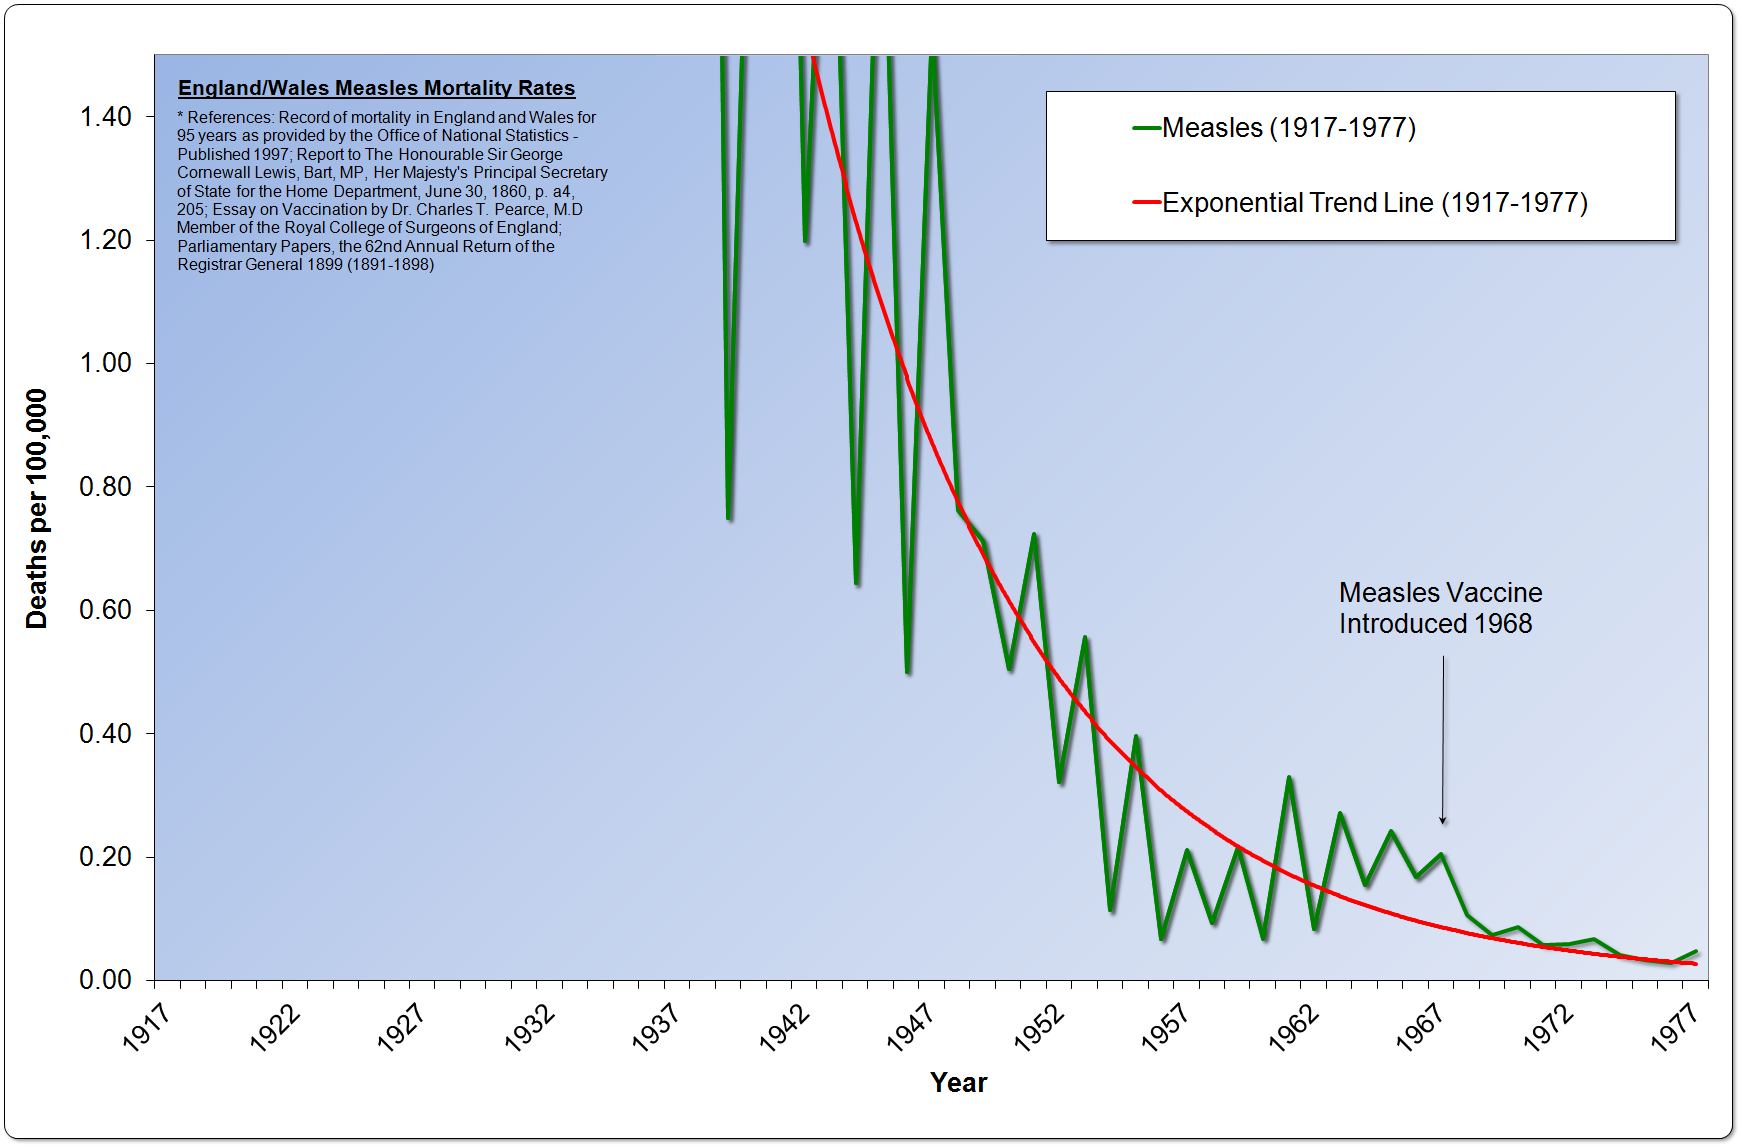
England/Wales Measles Mortality Rates With Trend Line 1917-1977– Magnified (Record of mortality in England and Wales for 95 years as provided by the Office of National Statistics – Published 1997; Report to The Honourable Sir George Cornewall Lewis, Bart, MP, Her Majesty’s Principal Secretary of State for the Home Department, June 30, 1860, p. a4, 205; Essay on Vaccination by Dr. Charles T. Pearce, M.D Member of the Royal College of Surgeons of England; Parliamentary Papers, the 62nd Annual Return of the Registrar General 1899 (1891-1898))
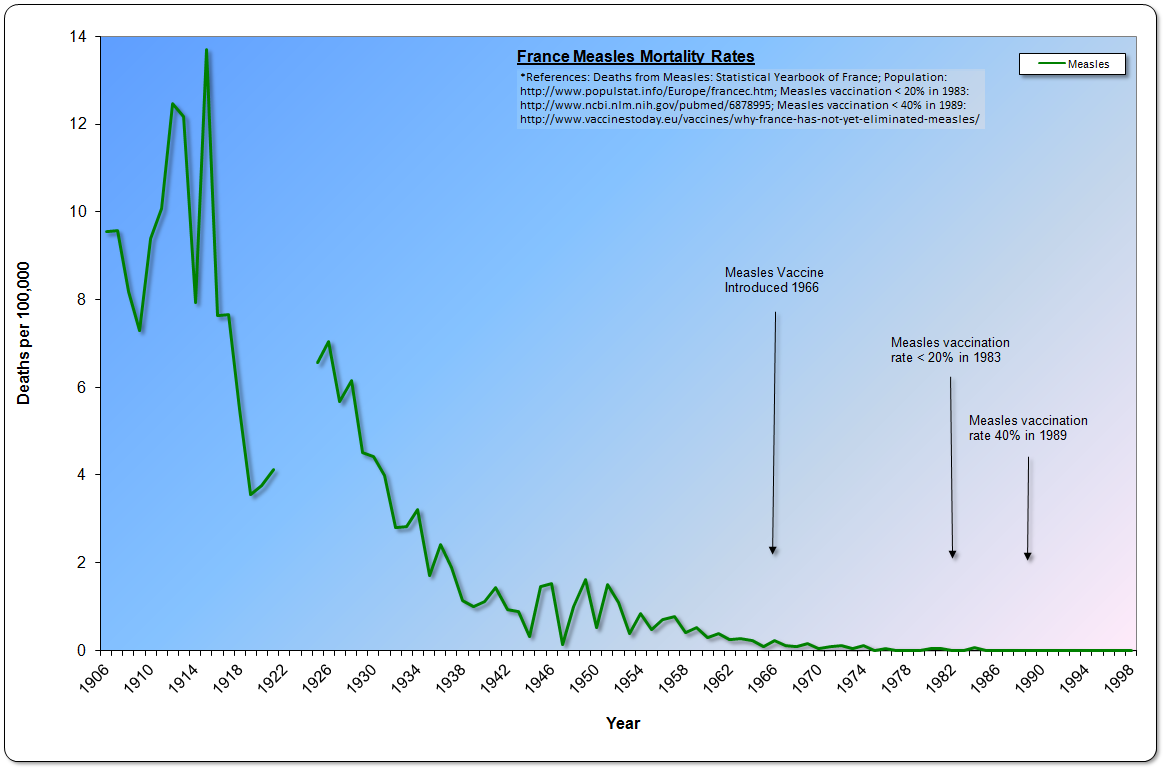
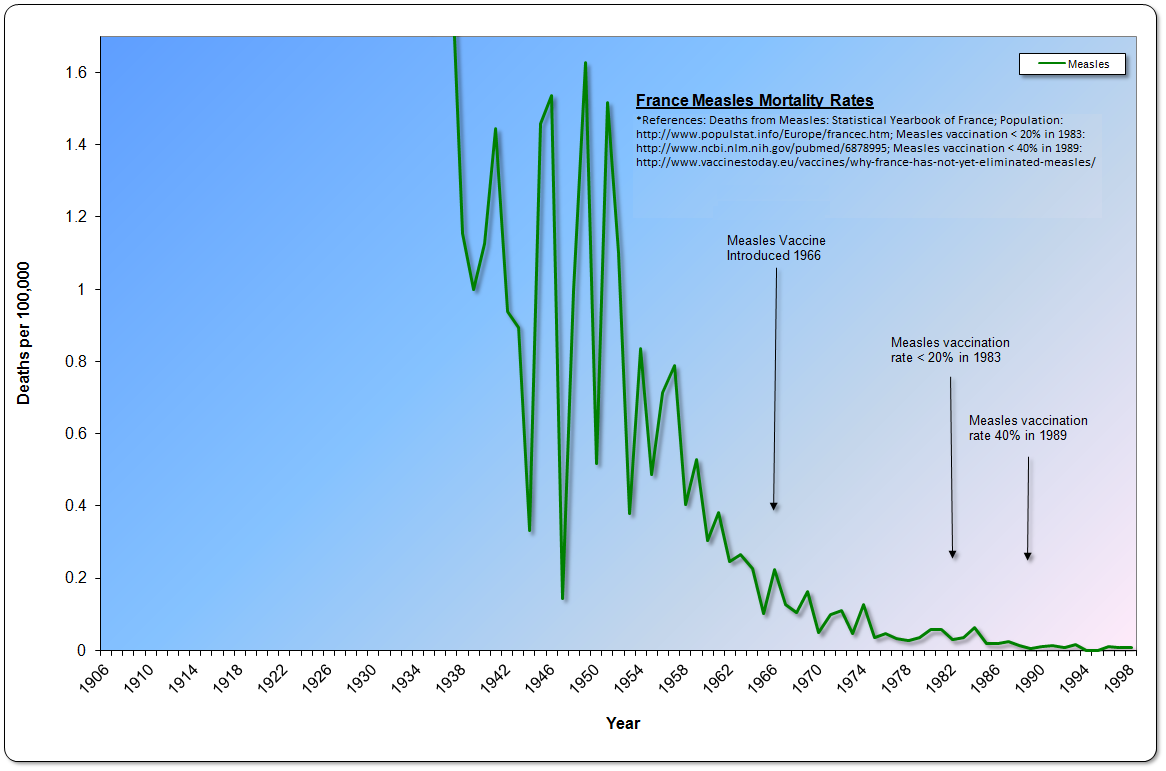
France Measles Mortality Rates 1906-1998 (Deaths from Measles: Statistical Yearbook of France; Population: http://www.populstat.info/Europe/francec.htm; Measles vaccination < 20% in 1983: http://www.ncbi.nlm.nih.gov/pubmed/6878995)
France Measles Mortality Rates 1906-1998 – Magnified (Deaths from Measles: Statistical Yearbook of France; Population: http://www.populstat.info/Europe/francec.htm; Measles vaccination < 20% in 1983: http://www.ncbi.nlm.nih.gov/pubmed/6878995)
Figures
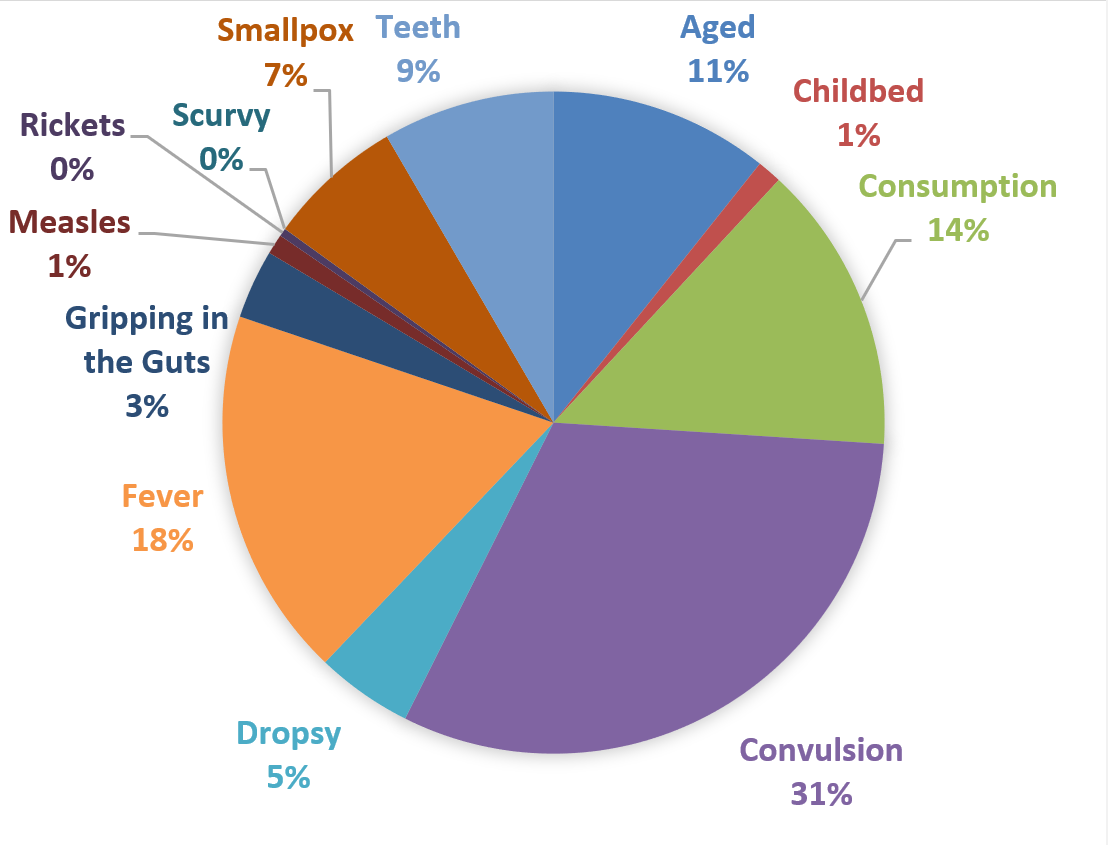
Figure 3.1: London listed causes of death in 1720. (Authors’ original diagram based on London Bills of Mortality) *Tenth Anniversary Edition Only
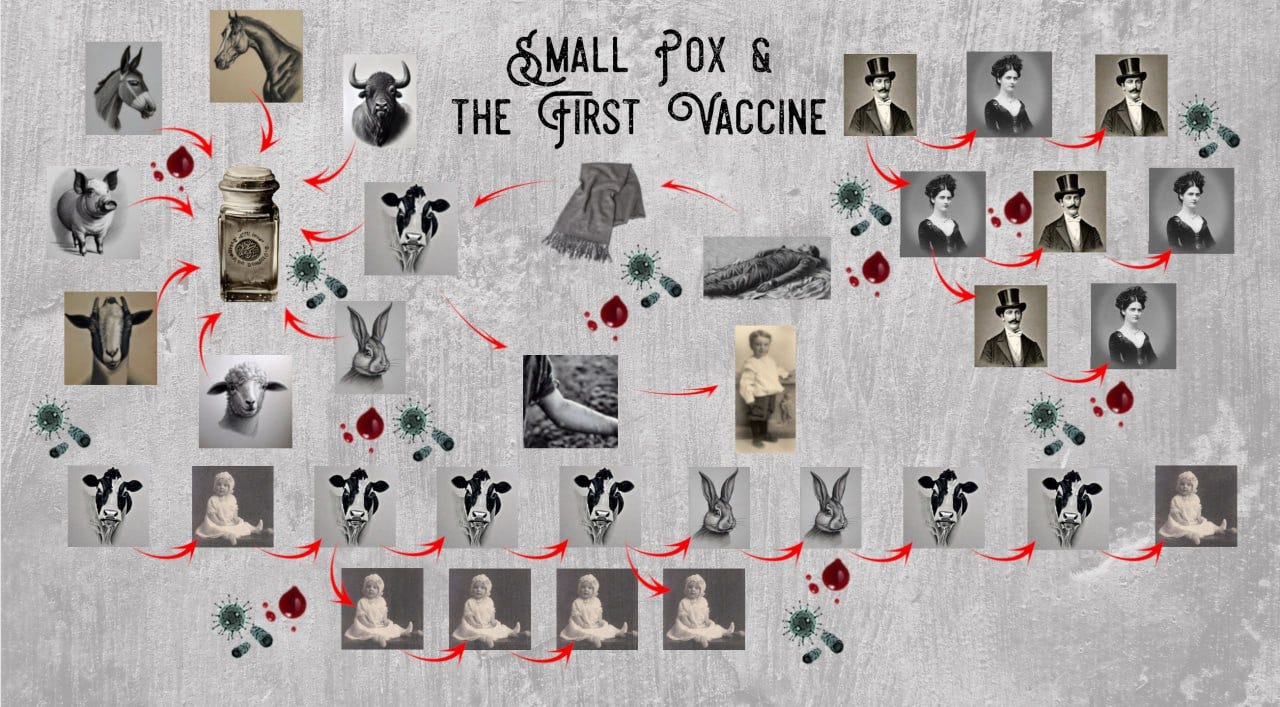
Figure 4.1: Small Pox & The First Vaccine. (Authors’ original diagram, Graphic Art Design by Sonja Carloff) *Tenth Anniversary Edition Only
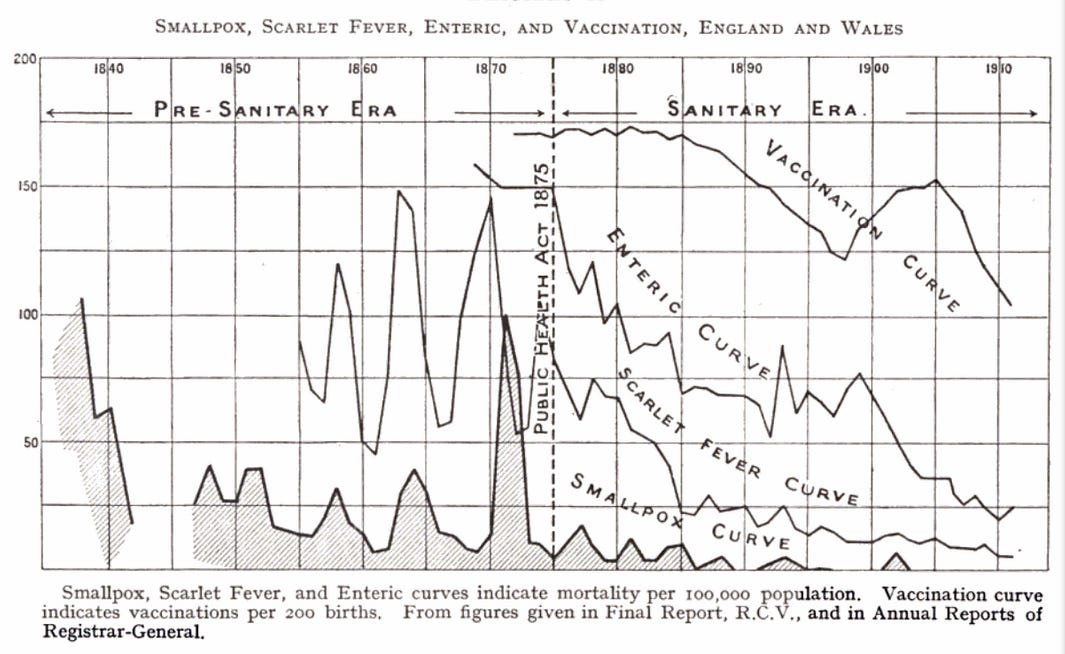
Figure 10.1: England and Wales death rate for scarlet fever, enteric fever, and smallpox 1838-1912. In addition, vaccination rate curve from 1872-1912. (C. Killick Millard, The Vaccination Question in the Light of Modern Experience: An Appeal for Reconsideration, 1914, London, p. 16.) *Tenth Anniversary Edition Only
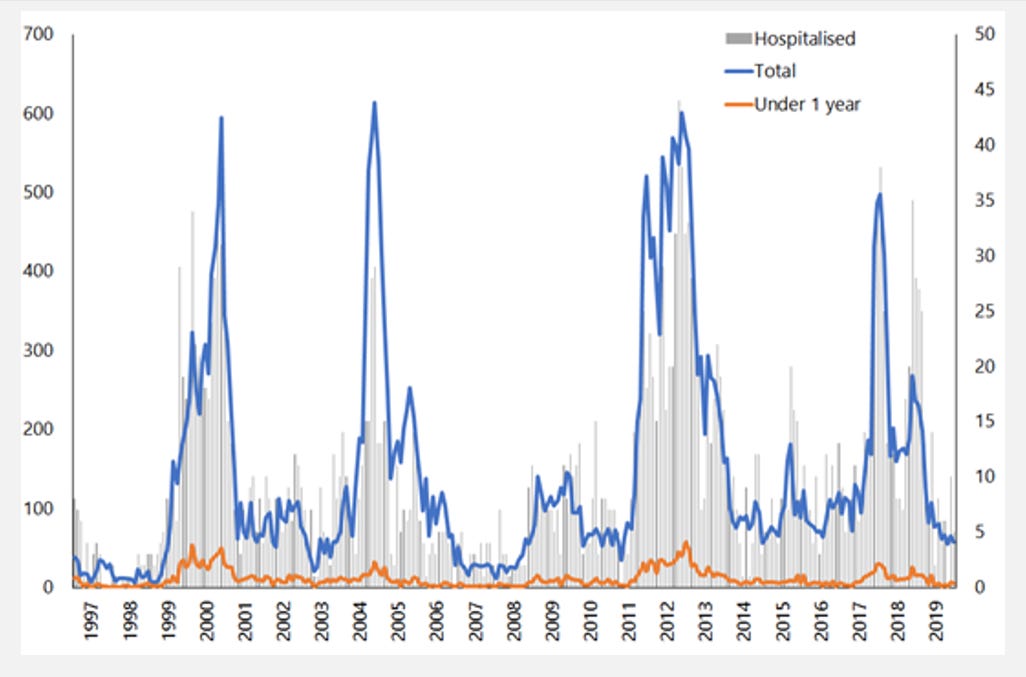
Figure 16.2: New Zealand Pertussis notifications and hospitalisations, 1997–2019 (New Zealand Immunisation Handbook—15. Pertussis (whooping cough): https://www.health.govt.nz/our-work/immunisation-handbook-2020/15-pertussis-whooping-cough) *Tenth Anniversary Edition Only
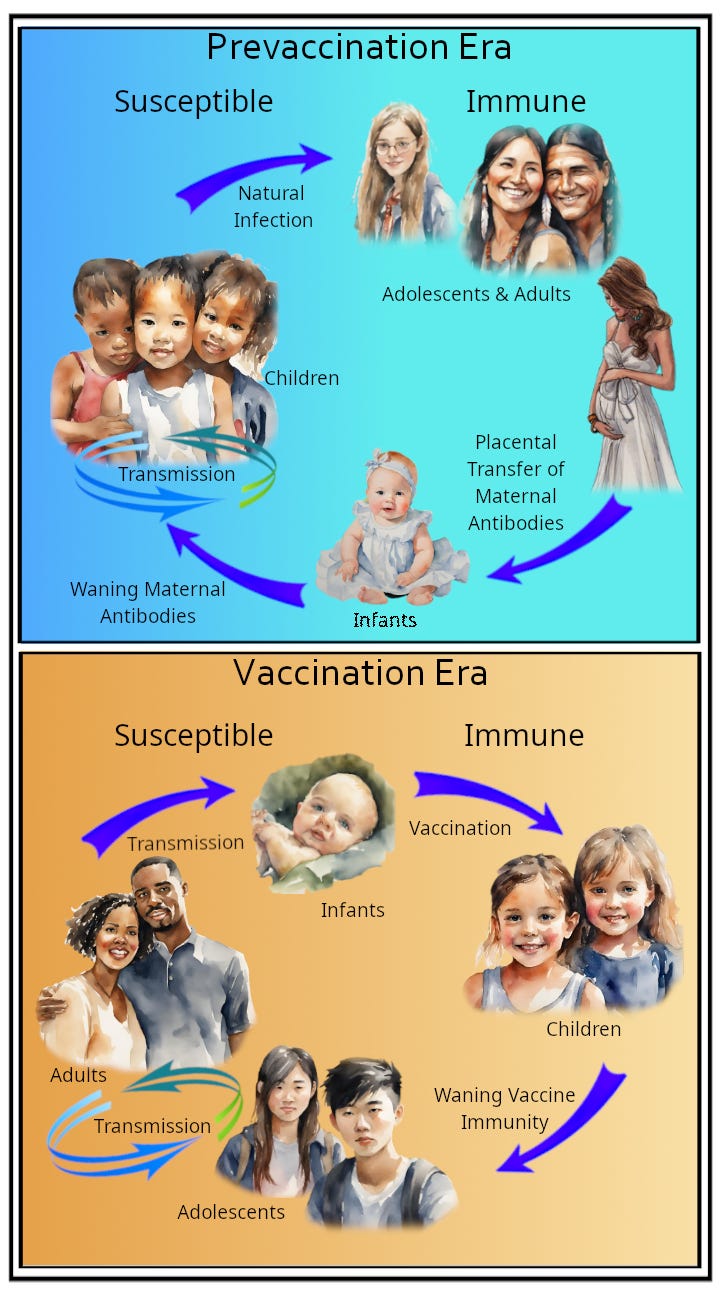
Figure 16.3: Prevaccination vs. Vaccination Era. (Authors’ original diagram, Graphic Art Design by Sonja Carloff) based on information in Erik L Hewlett and Kathryn M Edward, “Clinical practice. Pertussis—not just for kids,” New England Journal of Medicine, March 24, 2005 (12), pp. 1215–1222.) *Tenth Anniversary Edition Only
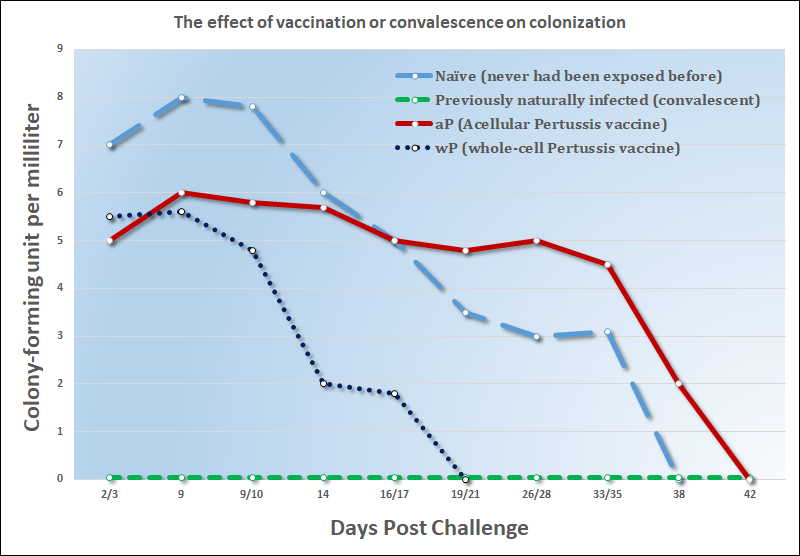
Figure 16.4: The effect of vaccination or convalescence on colonization. Naïve animals, aP-vaccinated animals, wP-vaccinated animals, and previously infected (convalescent) animals were directly challenged with B. pertussis. (Authors’ original diagram based on information in Jason M. Warfel, Lindsey I. Zimmerman, and Tod J. Merkel, “Acellular pertussis vaccines protect against disease but fail to prevent infection and transmission in a nonhuman primate model,” Proceedings of the National Academy of Sciences, 2013.) *Tenth Anniversary Edition Only
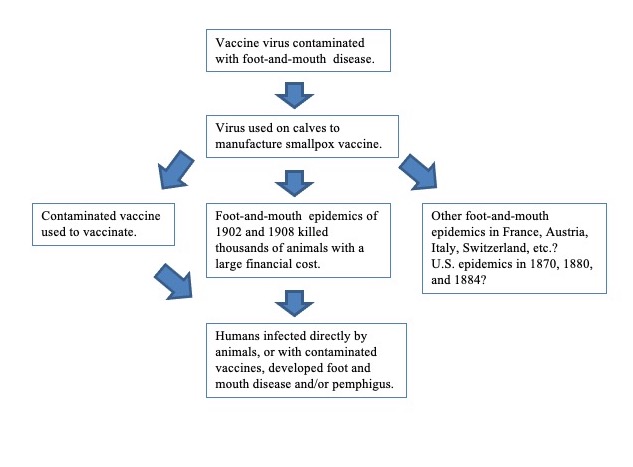
Figure 7.1: Connection between vaccines and foot-and-mouth disease. (Authors’ original diagram) *First Edition: Figure 5.1
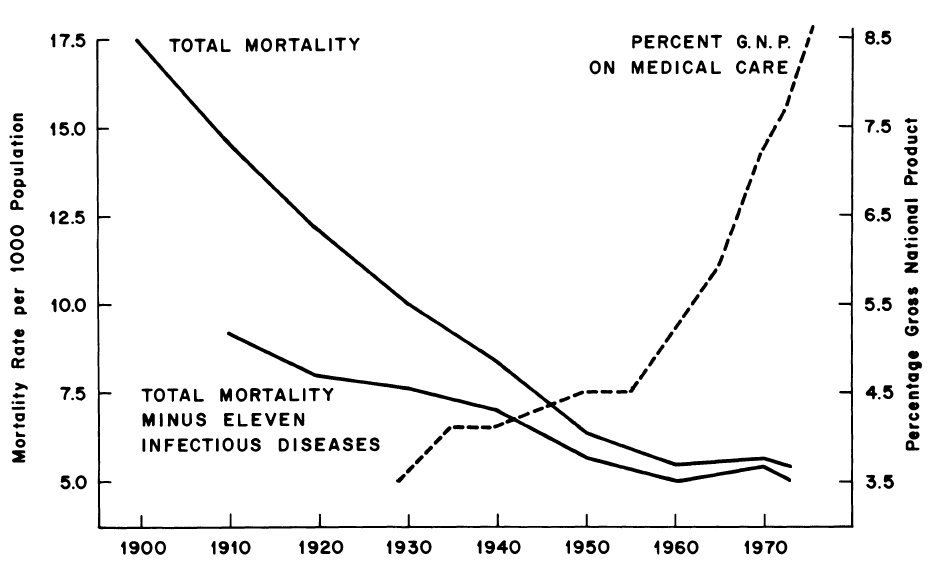
Figure 14.1: Age- and Sex-adjusted Mortality Rates for the United States 1900-1973, Including and Excluding Eleven Major Infectious Diseases, Contrasted with the Proportion of the Gross National Product Expended on Medical Care. (John B. McKinlay and Sonja M. McKinlay, “The Questionable Contribution of Medical Measures to the Decline of Mortality in the United States in the Twentieth Century,” The Milbank Memorial Fund Quarterly, Health and Society, vol. 55, no. 3, summer 1977, p. 415) *First Edition: Figure 11.1
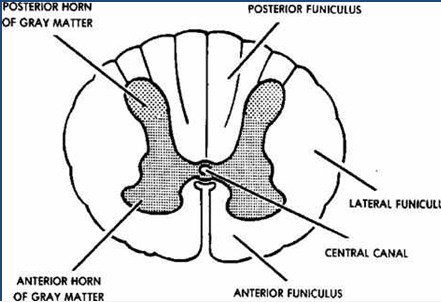
Figure 15.1: Spinal cross-section. (“The Spinal Cord,” Nursing Care for Neurological Patients, SweetHaven Publishing Services, 2006, www.free-ed.net/sweethaven/MedTech/NurseCare/NeuroNurse01.asp?iNum=4, accessed July 2013) *First Edition: Figure 12.1
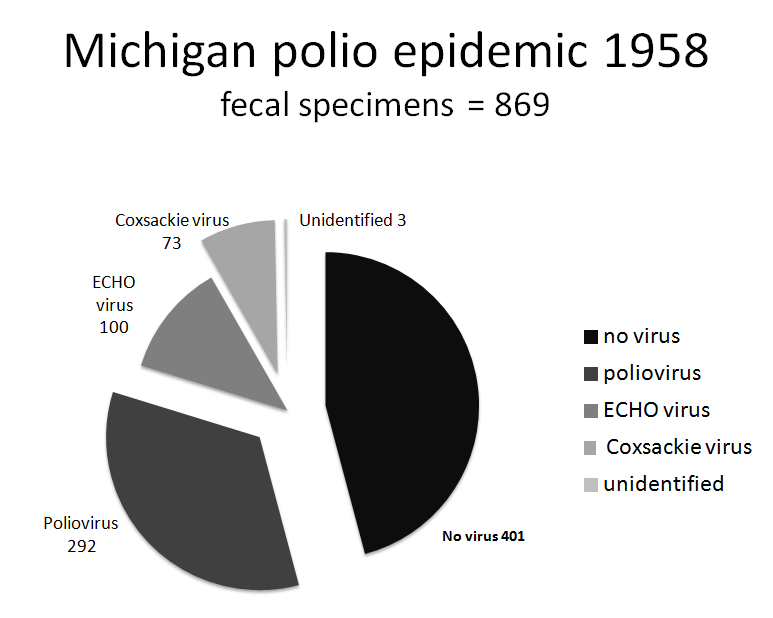
Figure 15.2: Michigan polio 1958 – epidemic virus identification via fecal analysis. (G. C. Brown, “Laboratory Data on the Detroit Poliomyelitis Epidemic 1958,” Journal of the American Medical Association, vol. 172, February 20, 1960, pp. 807–812) *First Edition: Figure 12.2
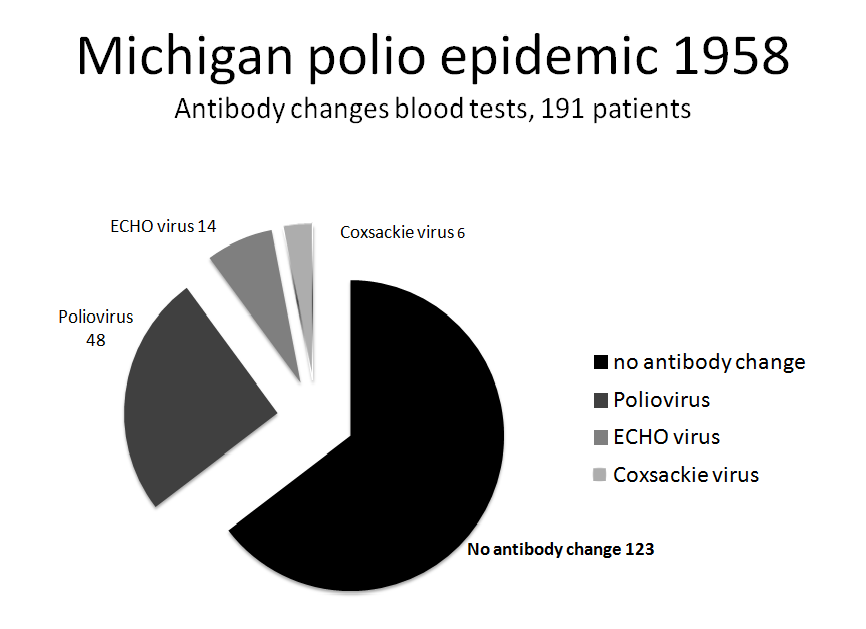
Figure 15.3: Michigan polio 1958 – epidemic viral antibody changes. (G. C. Brown, “Laboratory Data on the Detroit Poliomyelitis Epidemic 1958,” Journal of the American Medical Association, vol. 172, February 20, 1960, pp. 807–812) *First Edition: Figure 12.3
Figure 15.4: Polio incidence and DDT production in the U.S. 1940-1970. (c/o Jim West, research timeline available at https://harvoa.org/polio/index.htm#indyRes; Original chart version was published in the Townsend Letter for Doctors and Patients, 2000) *First Edition: Figure 12.4
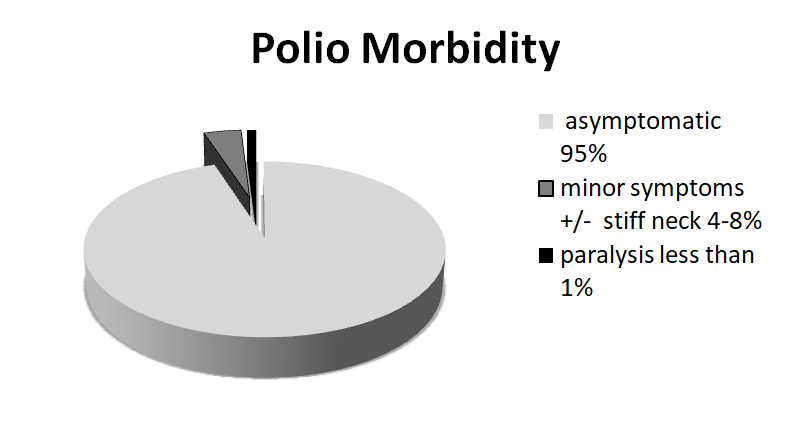
Figure 15.5: Polio morbidity. (“Polio Disease In-Short,” Centers for Disease Control and Prevention, Department of Health and Human Services, www.cdc.gov/vaccines/vpd-vac/polio/in-short-both.htm, accessed June 17, 2013) *First Edition: Figure 12.5
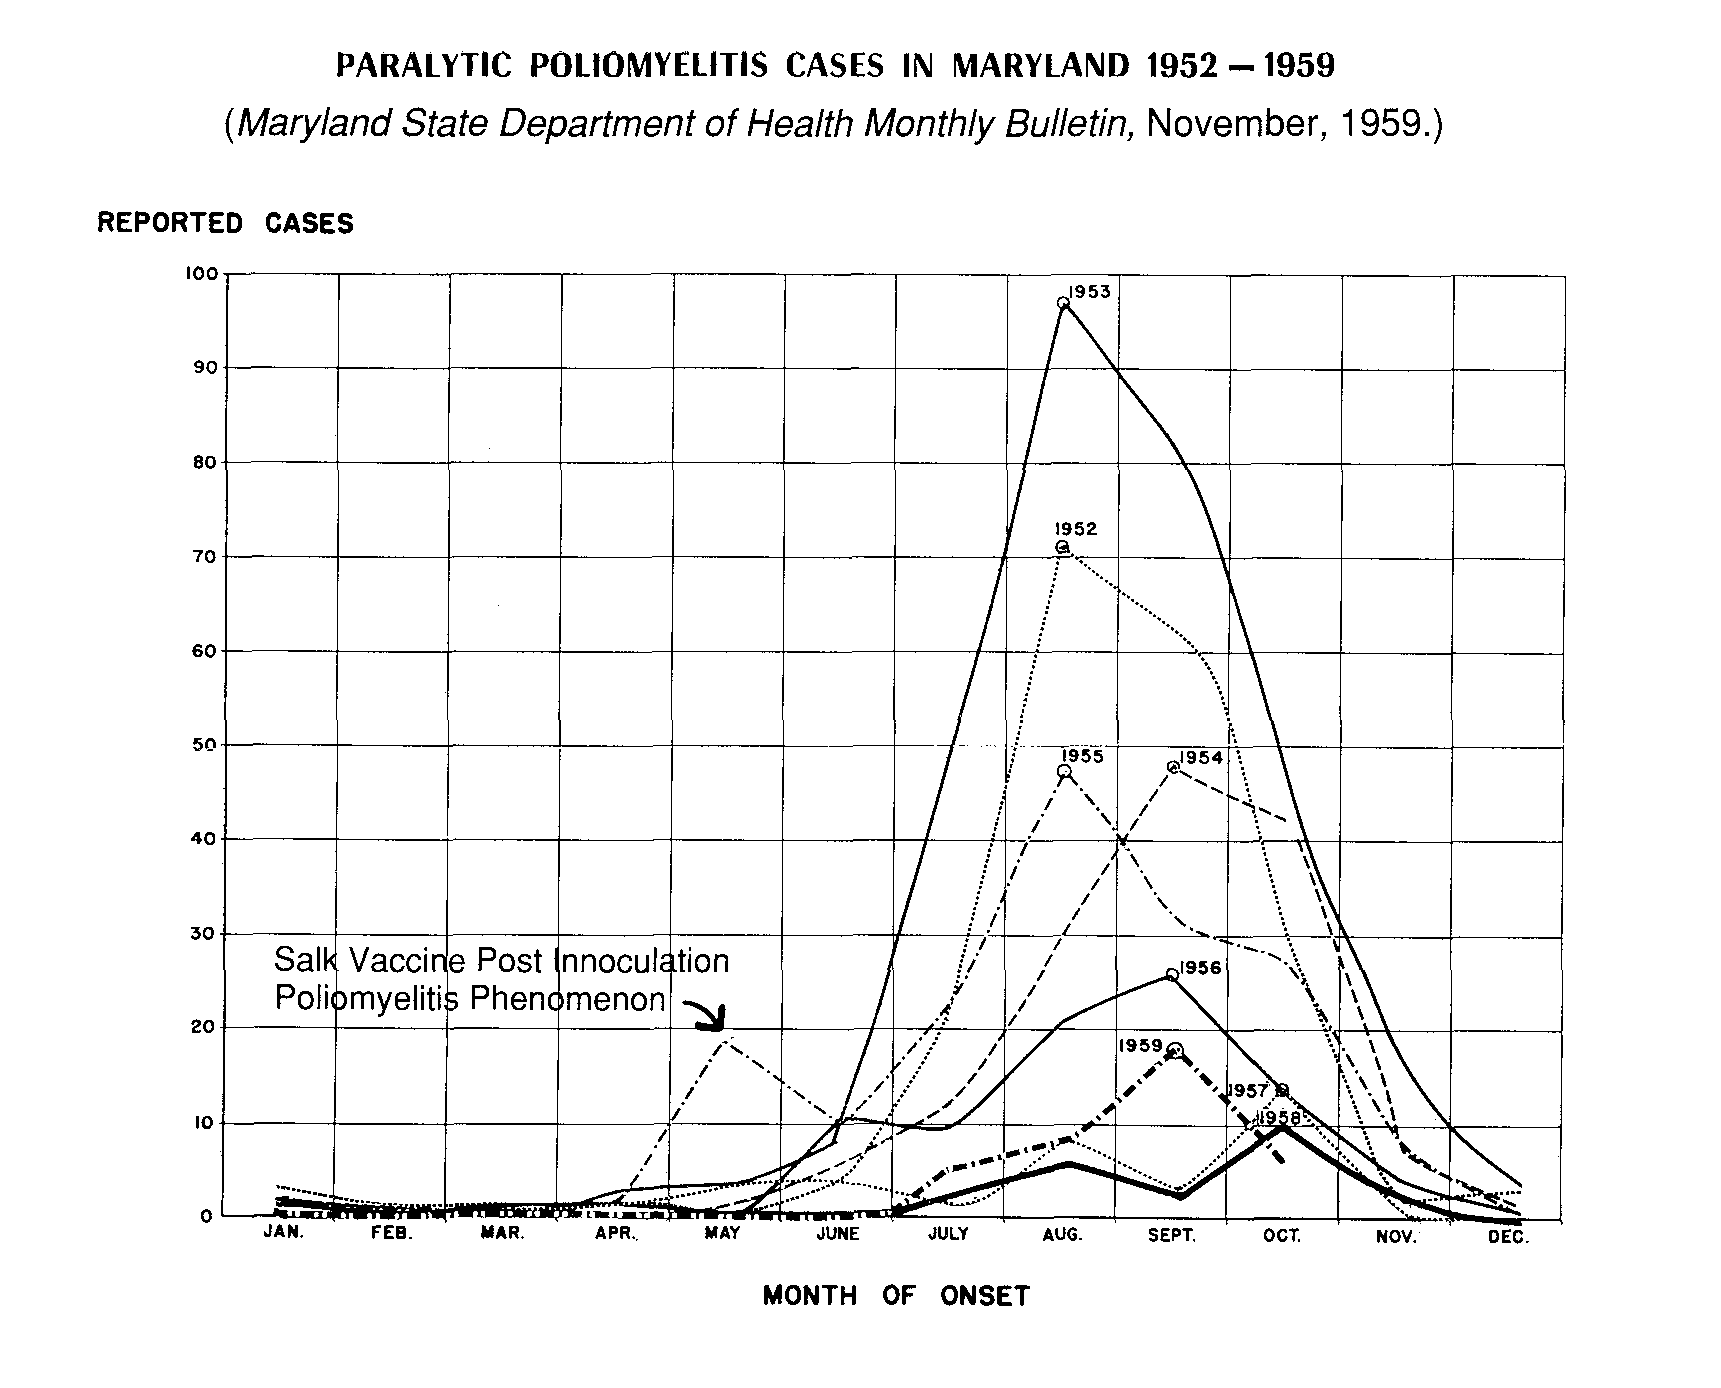
Figure 15.6: Paralytic poliomyelitis cases in Maryland from 1952 to 1959. (H. Ratner, “An Untold Vaccine Story,” Child and Family, vol. 21, no. 3, 1993, pp. 253–263) *First Edition: Figure 12.6
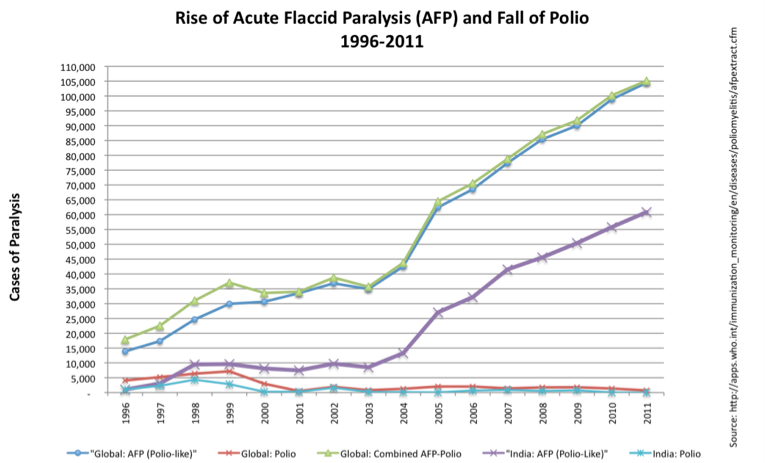
Figure 15.7: Acute Flaccid Paralysis (AFP) and Polio from 1996 to 2011. (http://apps.who.int/immunization_monitoring/en/diseases/poliomyelitis/afpextract.cfm, accessed June 2012) *First Edition: Figure 12.7
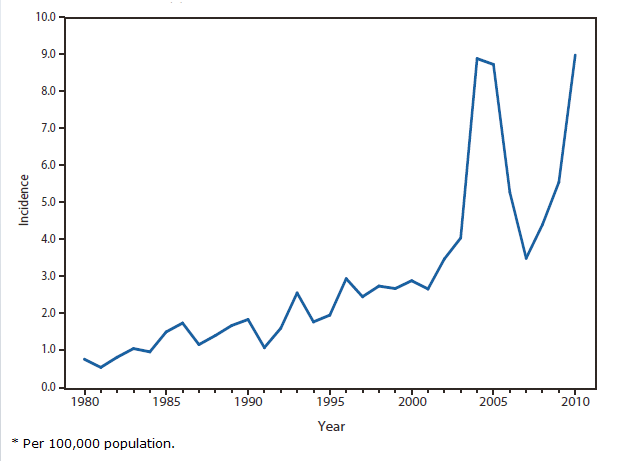
Figure 16.1: United States pertussis incidence by year from 1980 to 2010. (“Summary of Notifiable Diseases—United States, 2009,” MMWR, vol. 58, no. 53, May 13, 2011, www.cdc.gov/mmwr/preview/mmwrhtml/mm5853a1.htm, accessed July 2013) *First Edition: Figure 13.1
Additional Figures
Vital Statistics of the United States 1940-1960 Title Page (Vital Statistics of the United States 1940-1960, https://www.cdc.gov/nchs/data/vsus/vsrates1940_60.pdf)
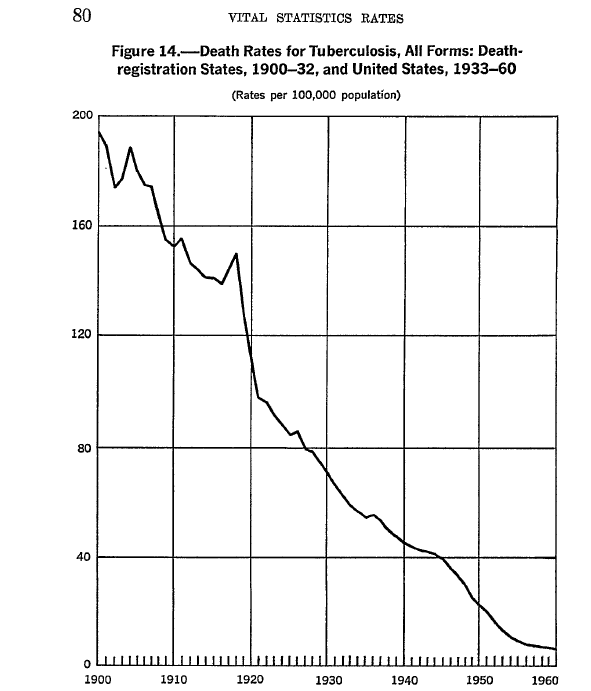
Death Rates for Tuberculosis 1900-1960 Title Page (Vital Statistics of the United States 1940-1960, p. 80, https://www.cdc.gov/nchs/data/vsus/vsrates1940_60.pdf)
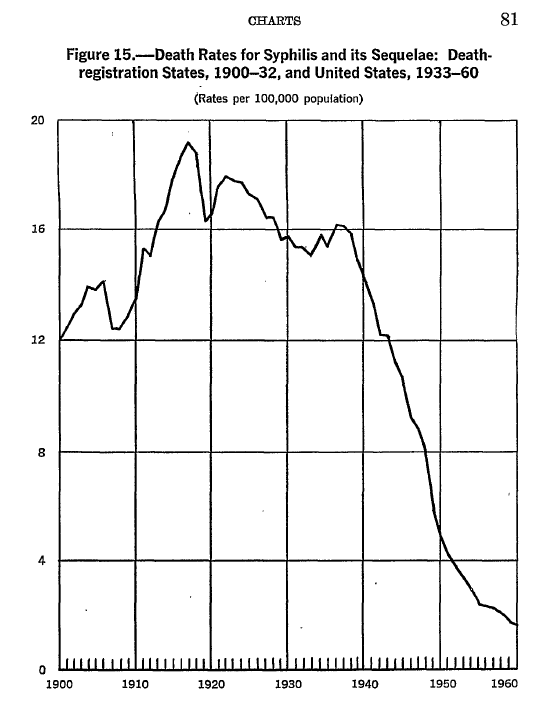
Death Rates for Syphilis 1900-1960 Title Page (Vital Statistics of the United States 1940-1960, p. 81, https://www.cdc.gov/nchs/data/vsus/vsrates1940_60.pdf)
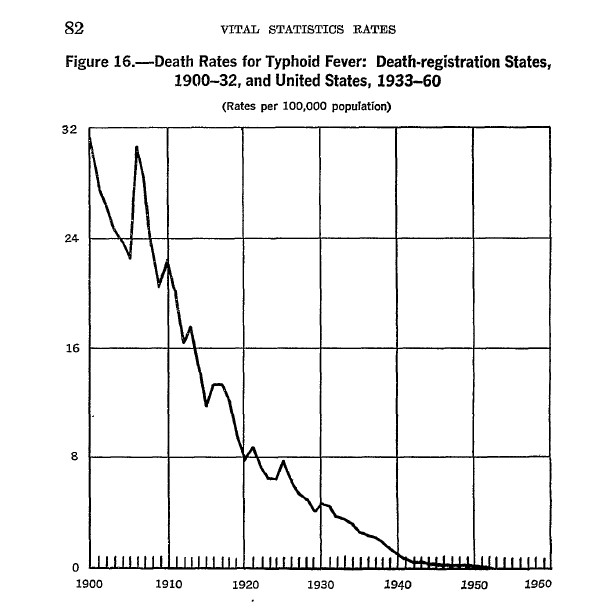
Death Rates for Typhoid Fever 1900-1960 Title Page (Vital Statistics of the United States 1940-1960, p. 82, https://www.cdc.gov/nchs/data/vsus/vsrates1940_60.pdf)
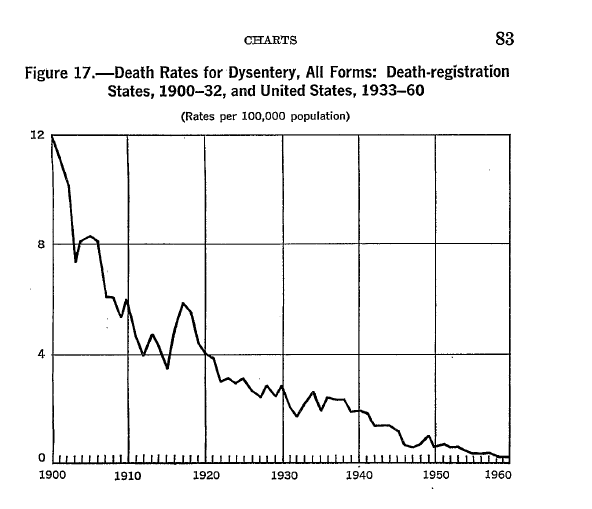
Death Rates for Dysentery 1900-1960 Title Page (Vital Statistics of the United States 1940-1960, p. 83, https://www.cdc.gov/nchs/data/vsus/vsrates1940_60.pdf)
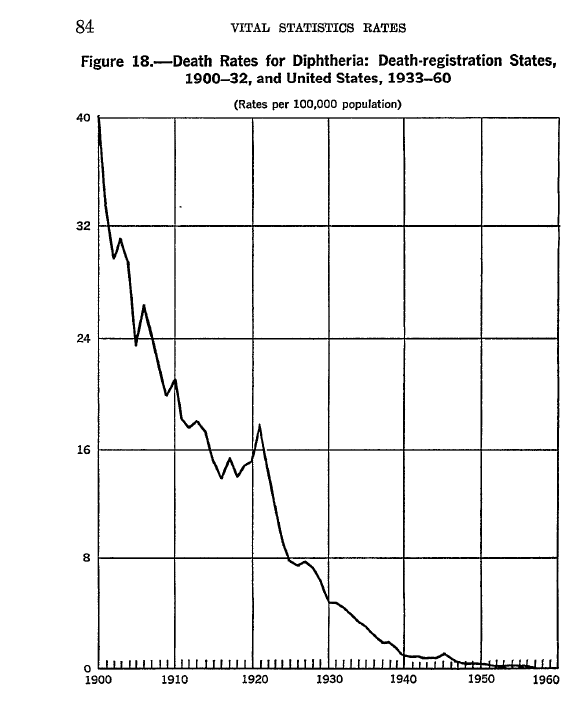
Death Rates for Diphtheria 1900-1960 Title Page (Vital Statistics of the United States 1940-1960, p. 84, https://www.cdc.gov/nchs/data/vsus/vsrates1940_60.pdf)
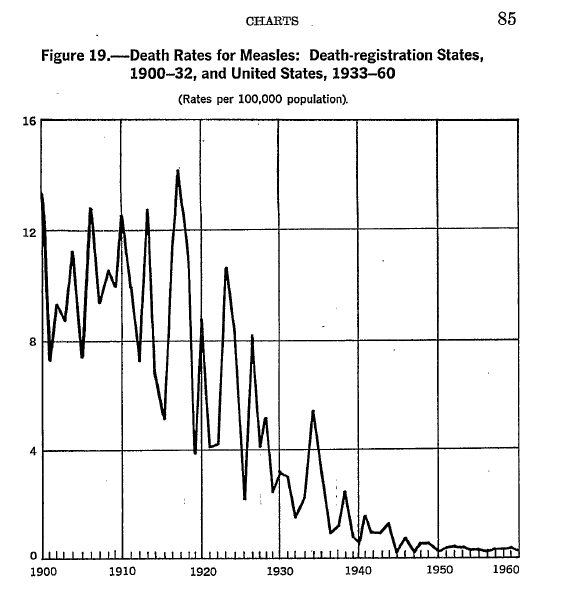
Death Rates for Measles 1900-1960 Title Page (Vital Statistics of the United States 1940-1960, p. 85, https://www.cdc.gov/nchs/data/vsus/vsrates1940_60.pdf)
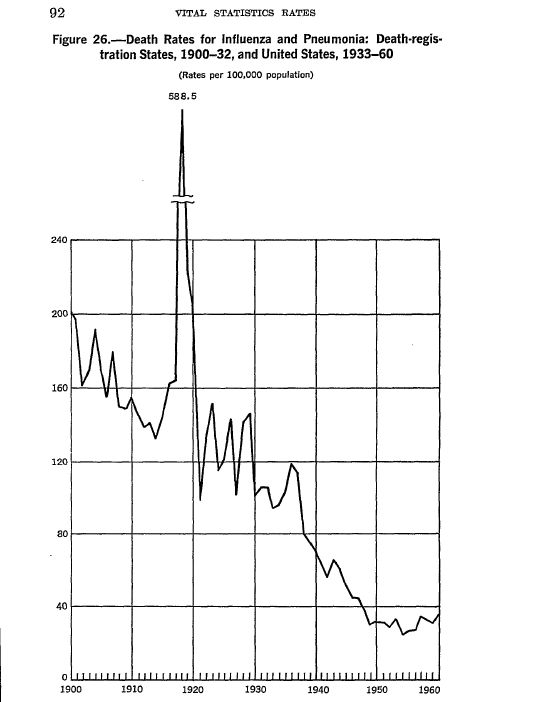
Death Rates for Influenza and Pneumonia 1900-1960 Title Page (Vital Statistics of the United States 1940-1960, p. 92, https://www.cdc.gov/nchs/data/vsus/vsrates1940_60.pdf)
Photos
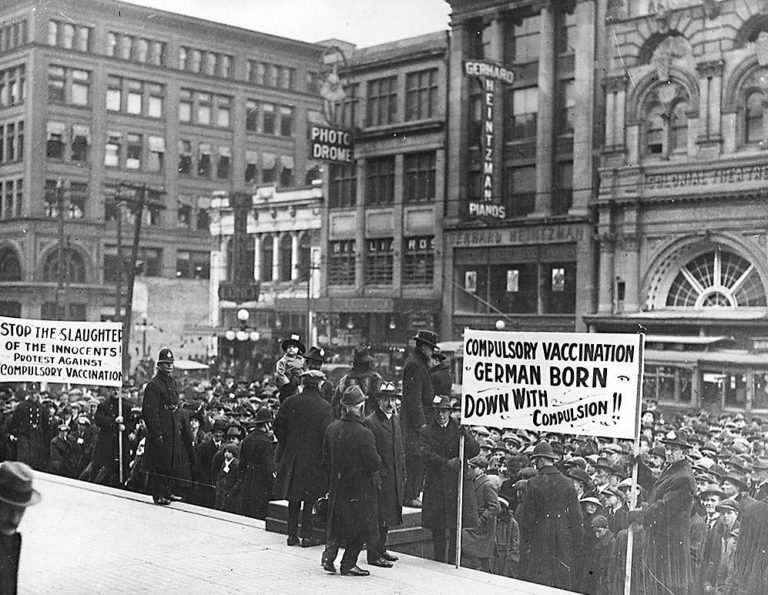
Anti-vaccination rally, 1920
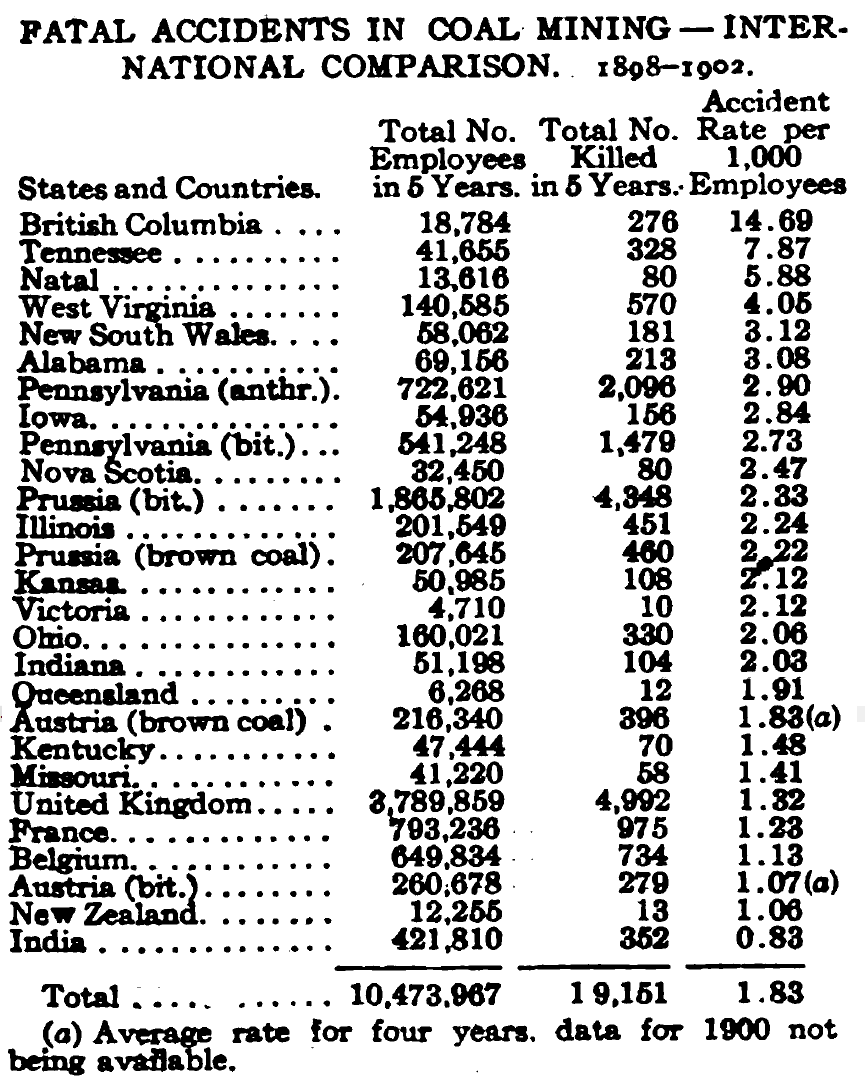
Photo 1.10: Fatal Accidents in Coal Mining—International Comparison. 1898-1902 [5 years]. (“Fatal Accidents in Coal Mining in 1903,” Engineering and Mining Journal, December 22, 1904, p. 990.) *Tenth Anniversary Edition Only
Photo 1.11: View of Leeds, Overlooking Kirkstall Road. (Julius B. Cohen, PhD, and Arthur G. Ruston, Smoke: A Study of Town Air, 1925, London, p. ii.) *Tenth Anniversary Edition Only
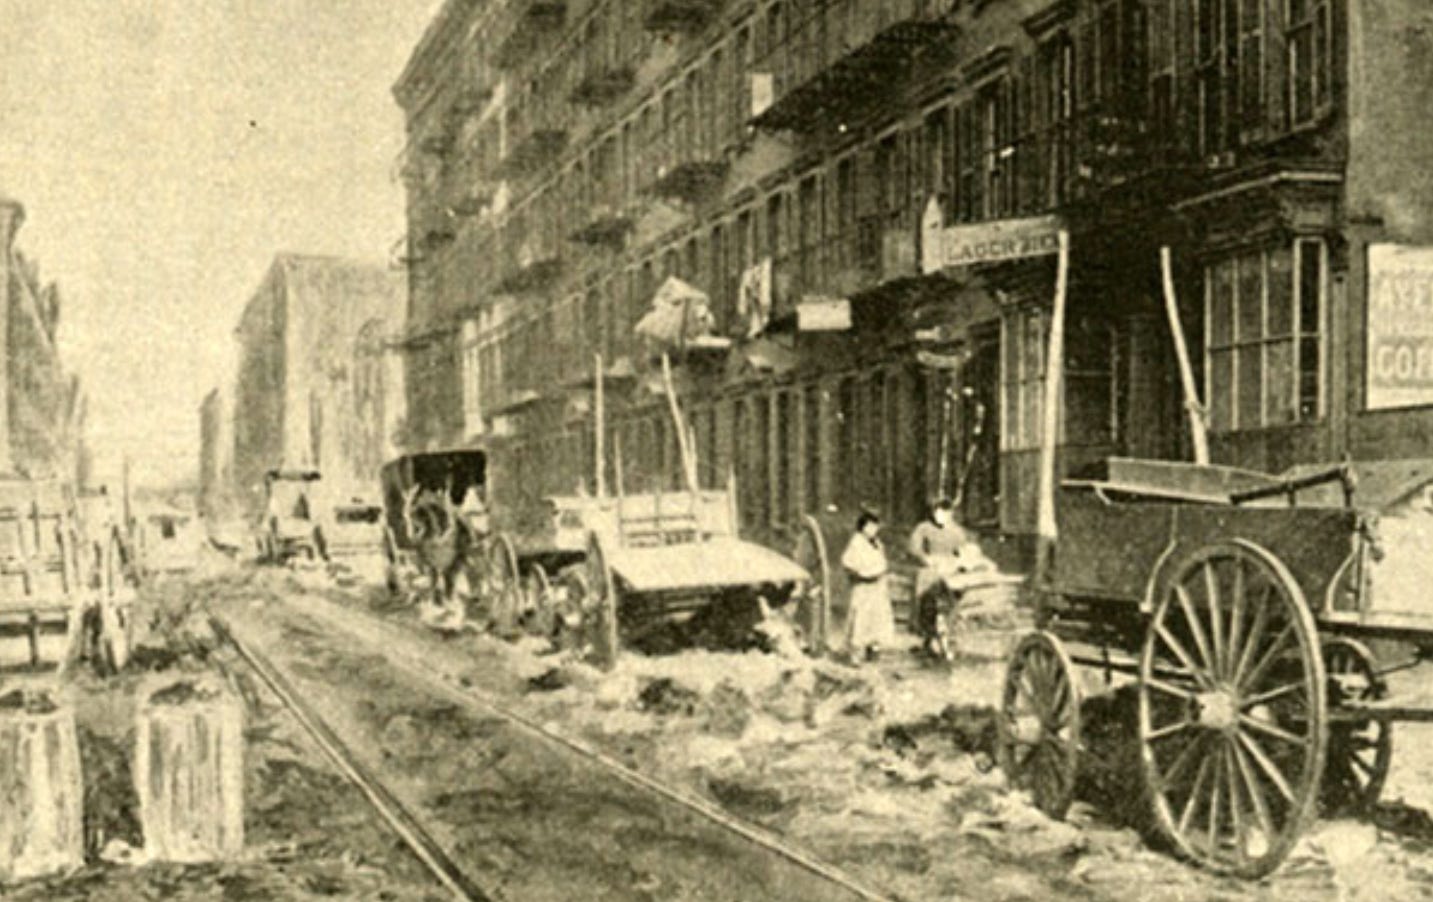
Photo 1.12: Goerck and Delancy Streets in New York City. The condition of the streets, with the masses of mud, manure, and other monstrous agglomeration of everything dangerous, unsightly, and offensive, is plainly indicated… Barrels and pails overladen with material, mingled in a foul mess of garbage and ashes, beset the sidewalks. In many cases these have been upset, and the unsavory contents emptied on the curbstone and into the gutter. (Harper’s Weekly, February 18, 1893, pp. 161, 166.) *Tenth Anniversary Edition Only
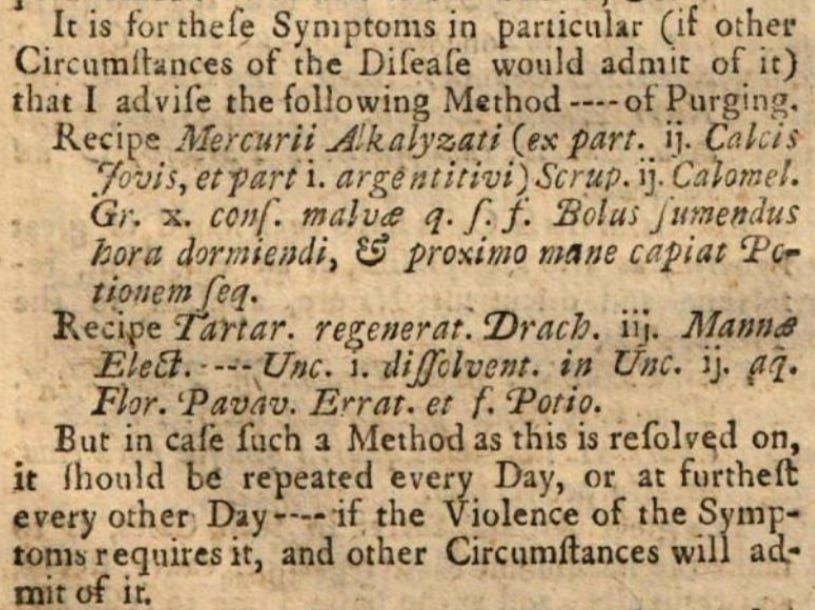
Photo 4.1: Charles Perry, MD’s prescription and recipe to promote purging in a smallpox case. (Charles Perry, MD, An Essay on the Smallpox, 1747, London. pp. 17–20.) *Tenth Anniversary Edition Only
Photo 4.3 Vaccine points bacterial colonies. (Dr. R. Swinburne Clymer, MD, PhD, Vaccination Brought Home to You, 1904, Terre Haute, Indiana, p. 48.) *Tenth Anniversary Edition Only
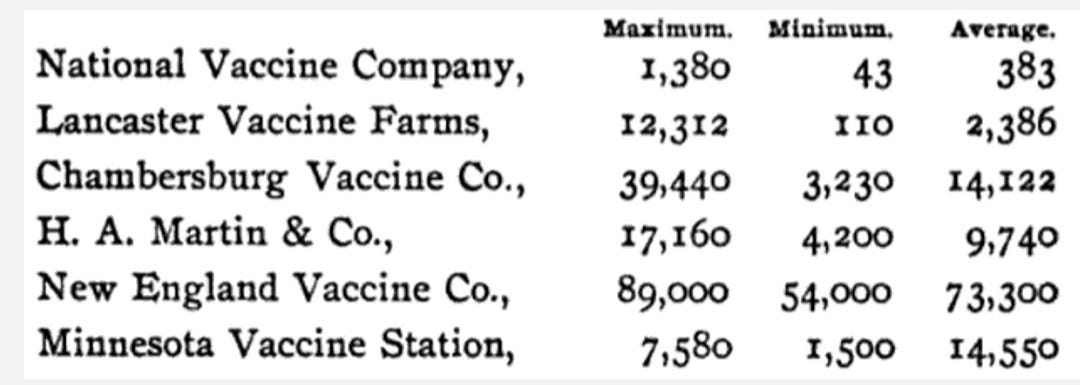
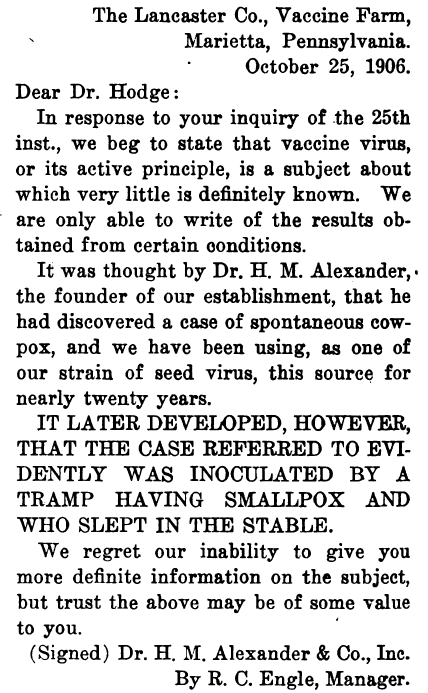
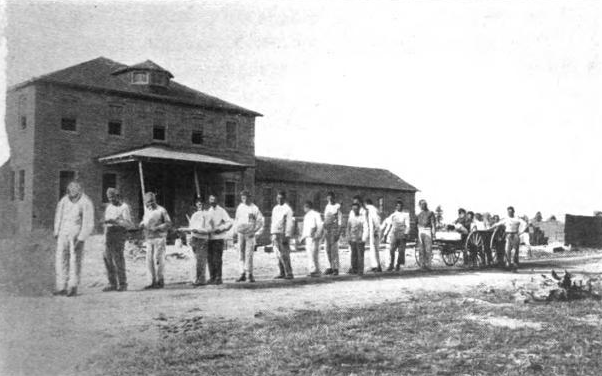
Photo 4.4 The Lancaster Co., Vaccine Farm, Marietta Pennsylvania. (1906). (“Vaccination,” Leaves of Healing, January 2, 1915, vol. XXXV, No. 14, p. 318.) *Tenth Anniversary Edition Only
Photo 6.1: A case of a man treated with calomel, resulting in a massively swollen tongue. (Wooster Beach, MD, The American Practice Condensed: Or, The Family Physician, 1850, New York, pp. 120–121) *Tenth Anniversary Edition Only
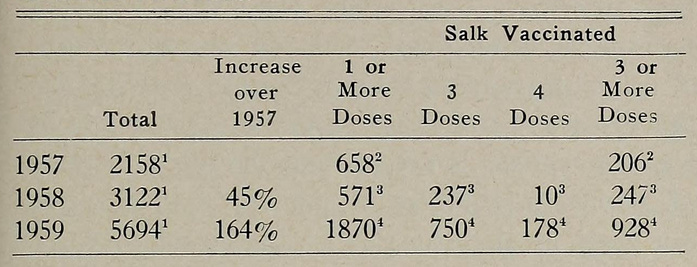
Photo 15.2: Paralytic polio cases in the United States in 1957, 1958, 1959, including paralytic polio cases in Salk vaccines. (“Intensive Immunization Programs,” Hearings Before the House of Representatives Committee on Interstate and Foreign Commerce on The Vaccination Assistance Act of 1962, H.R. 10541, May 15, 1962, p. 91.) *Tenth Anniversary Edition Only
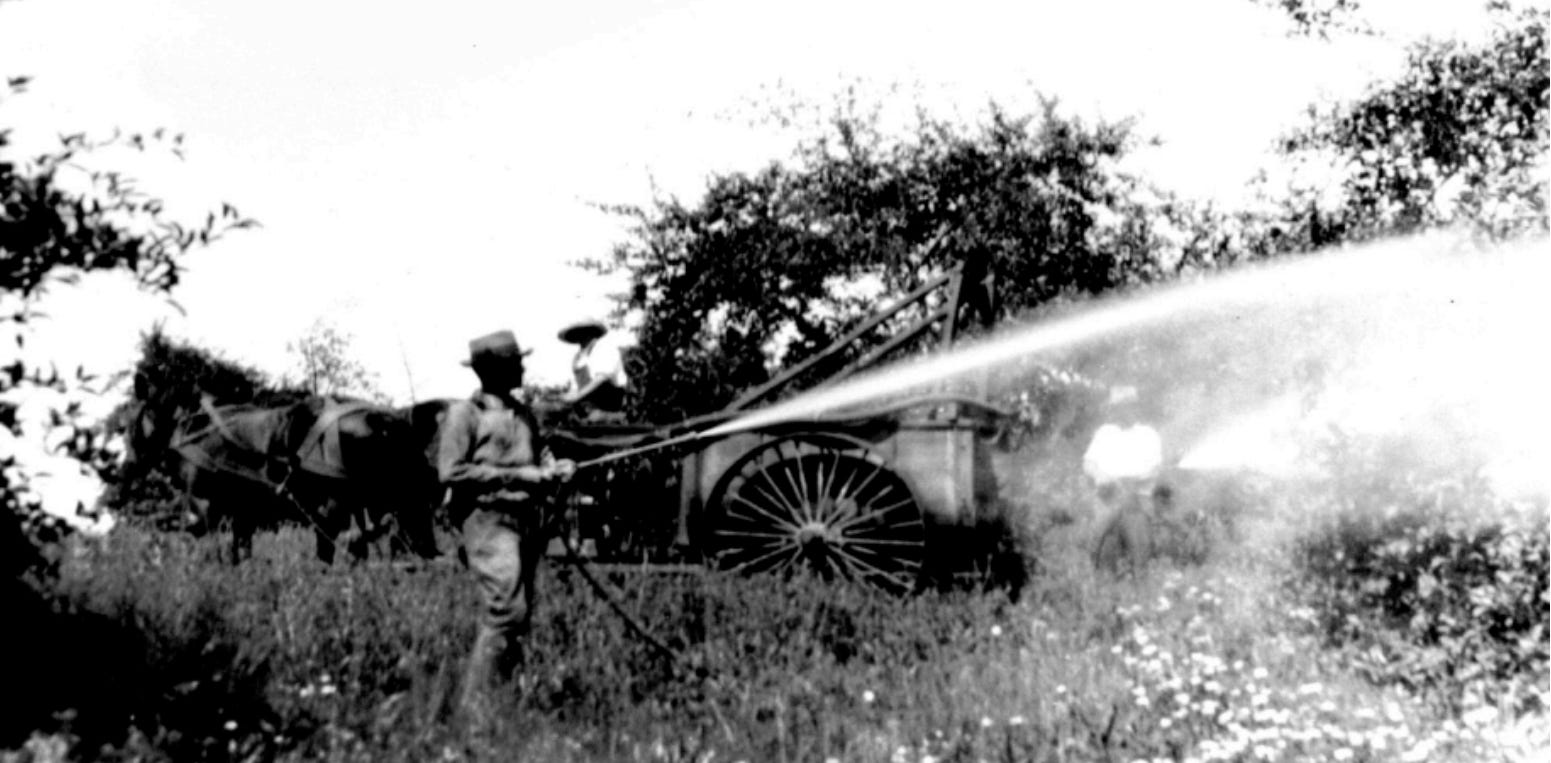
Photo 15.9: Spraying apple trees with lead arsenate at Blandy Experimental Farms (Boyce, VA). (1920s) (Therese Schooley, et al., “The History of Lead Arsenate Use in Apple Production: Comparison of its Impact in Virginia with Other States,” Journal of Pesticide Safety Education, vol. 10, 2008, p. 25.) *Tenth Anniversary Edition Only
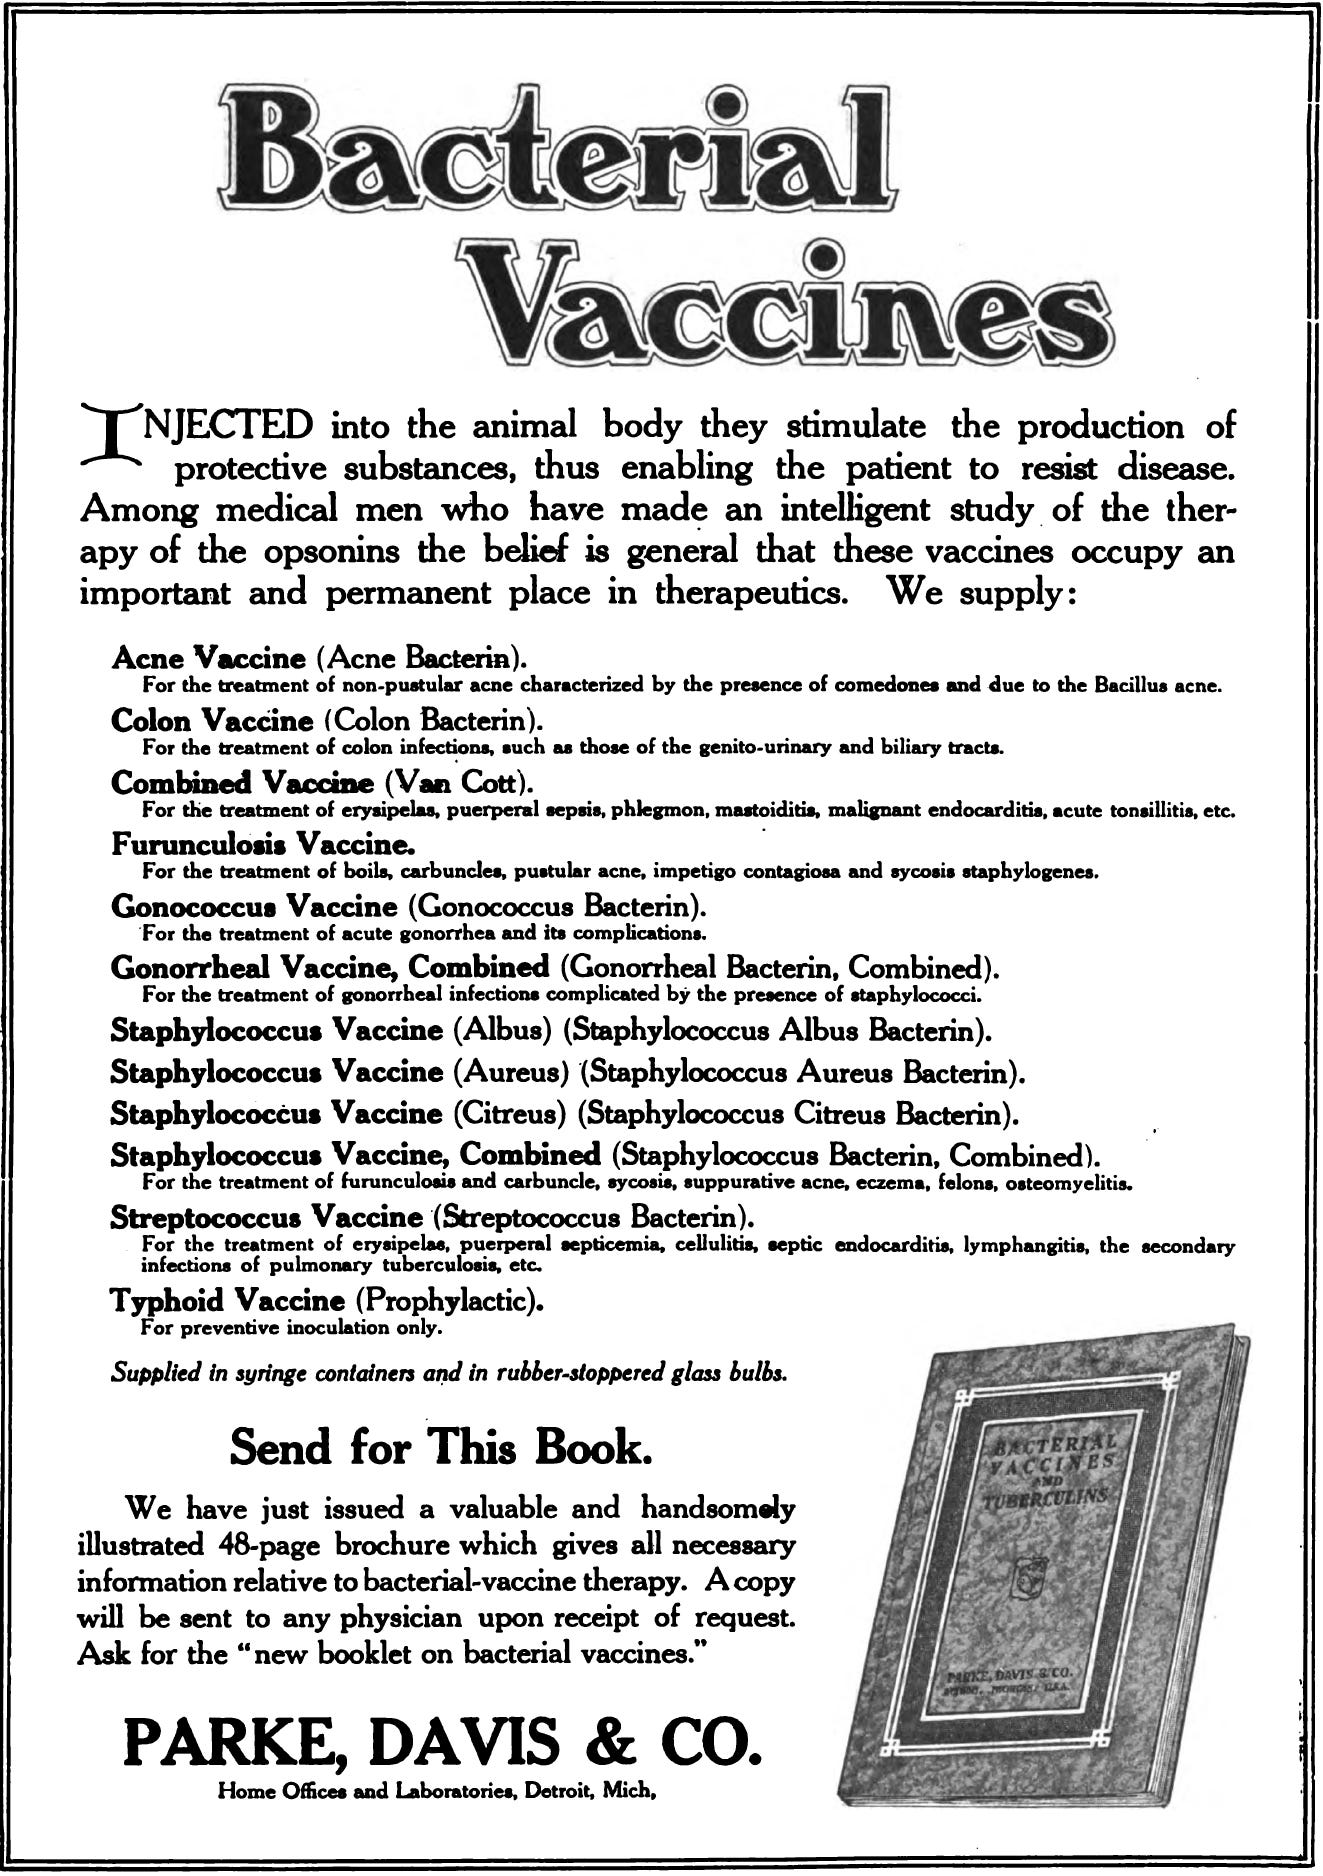
Photo 20.1: “Bacterial Vaccines.” Bacterial vaccines Parke-Davis advertisement. (The Medical Times, January 1912, p. 5.) *Tenth Anniversary Edition Only
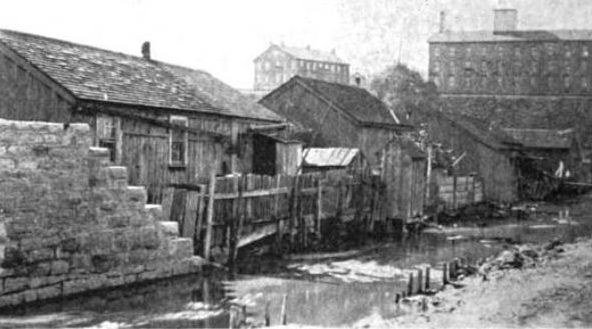
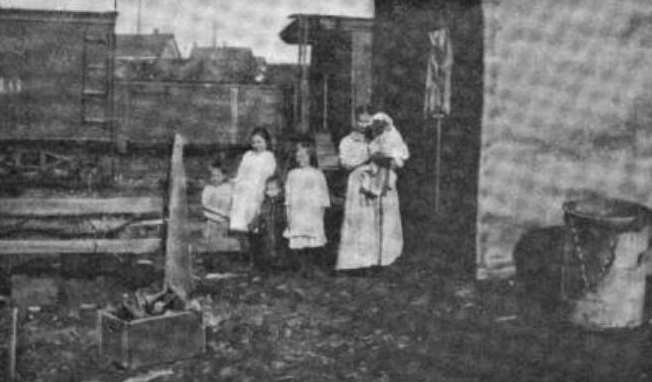
Photo 1.1: Syracuse, NY—Shanties Back to an Open Sewer. (Charities—A Weekly Review of Local and General Philanthropy, vol. VII, no. 23, December 7, 1901, p. 498)
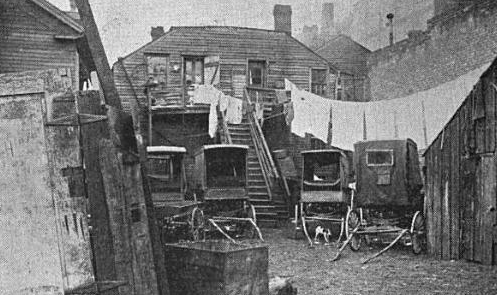
Photo 1.2: Jefferson Street. The shed barn at right contains three horses. The barn next in view contains six horses and two goats. The house in the center of the picture is full of Italian families and presents no redeeming feature. On the left are other tenements full of families. (Fifteenth Biennial Report of the Bureau of Labor and Industrial Statistics, Part V, Basement Tenements in Milwaukee, State of Wisconsin, 1911–1912, p. 152)
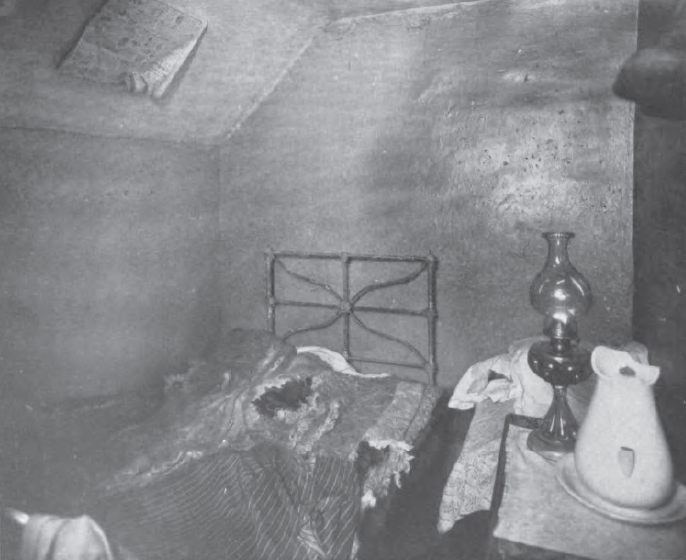
Photo 1.3: A so-called room of a three-room tenement, but it is merely a large size closet with a slanting ceiling, located under the main entrance stairs of the building. Here, in a three-quarter bed, sleep the father and mother and a little child. The rest of the family sleep in the front room and kitchen. This “room” has absolutely no light or ventilation. (The Women’s Municipal League of Boston Bulletin, vol. VII, no. 3, February 1916, p. 43)
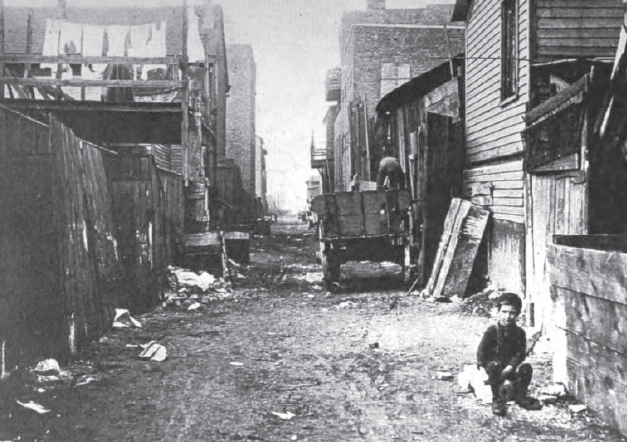
Photo 1.4: The general insanitary conditions which surround the houses on both sides of the alley. The first house on the right is a small dilapidated frame house. Beyond it are three larger tenements. The outbuildings at the left are all dilapidated, and contain privies which are in a foul condition. There are not enough garbage boxes to supply the needs, and the ones provided are so seldom cleaned that the families dump their slops and garbage in the alley. (Tenement Conditions in Chicago—Report by the Investigating Committee of the City Homes Association, 1901, p. 39)
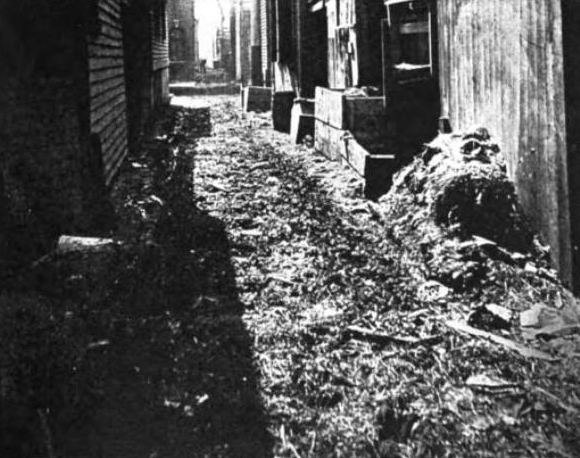
Photo 1.5: The conditions of the filth-strewn alleys, of courts and yards littered with rubbish, of ill-smelling stables and manure boxes find their climax and in part their cause in the accumulation of garbage. (Tenement Conditions in Chicago—Report by the Investigating Committee of the City Homes Association, 1901, p. 133)
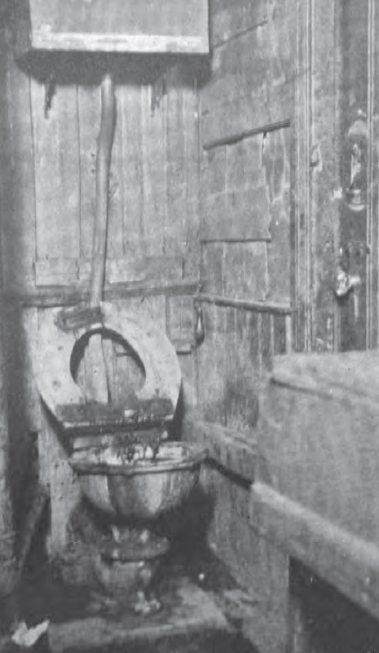
Photo 1.6: Water-closet used by fourteen families. (The Women’s Municipal League of Boston Bulletin, vol. VII, no. 3, February 1916, p. 32)
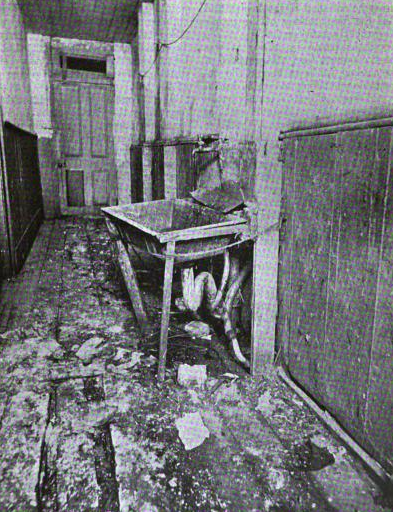
Photo 1.7: Public hall and sink. Sink supported only by string and flimsy wooden props. Hall floor covered with fecal matter and sewage. (Tenement-House Reform Charities, vol. XI, no. 16, for the week ending October 17, 1903, p. 359)
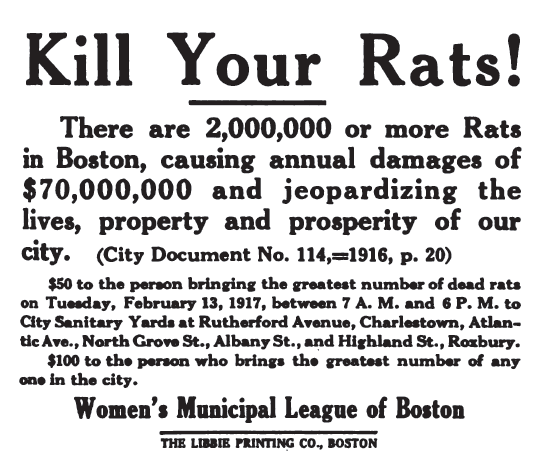
Photo 1.8: Kill Rats Poster. (The Women’s Municipal League of Boston Bulletin, vol. VIII, no. 2, January 1917, p. 25)
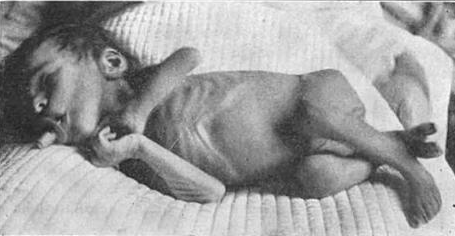
Photo 1.9: A case of Acute Milk Poisoning Having Vomiting, Diarrhoea, Mucous and Bloody Stools, General Emaciation, Acute Cholera Infantum, and Dysentery. (Louis Fischer, MD, Diseases of Infancy and Childhood: Their Dietetic, Hygienic, and Medical Treatment, F. A. Davis Company, 1914, p. 257)
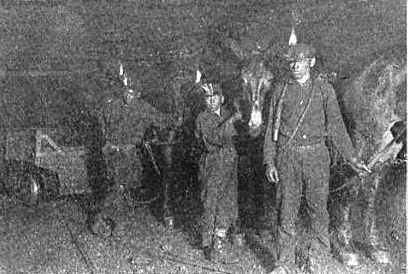
Photo 2.1: Boy coal miners. (The Child Labor Bulletin, August 1914, p. 67)
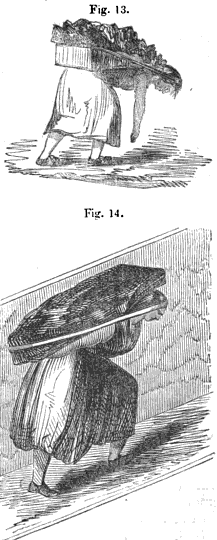
Photo 2.2: Girl and older girl using a creel to move coal. (Reports from Commissioners—Children Employment (Mines), February 3–August 12, 1842, p. 93)
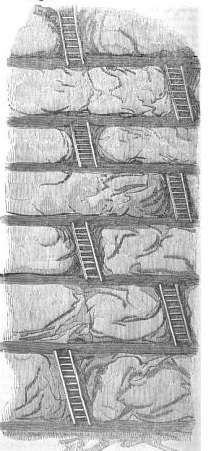
Photo 2.3: Typical passage a coal bearer traversed. (Reports from Commissioners—Children Employment (Mines), February 3–August 12, 1842, p. 92)
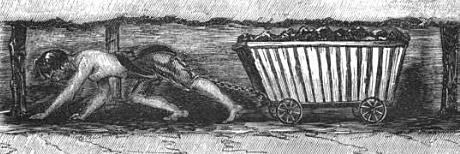
Photo 2.4: Child pulling corve. (Reports from Commissioners—Children Employment (Mines), February 3–August 12, 1842, p. 78)
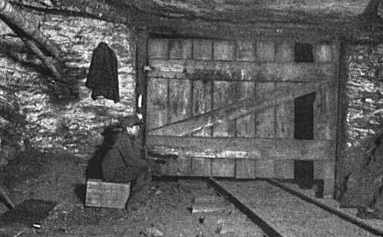
Photo 2.5: The Lonely Trapper Boy. (The Child Labor Bulletin, August 1914, p. 68)
Photo 2.6: Boys in the manufacturing of medicine bottles. (The Child Labor Bulletin, August 1914, p. 52)
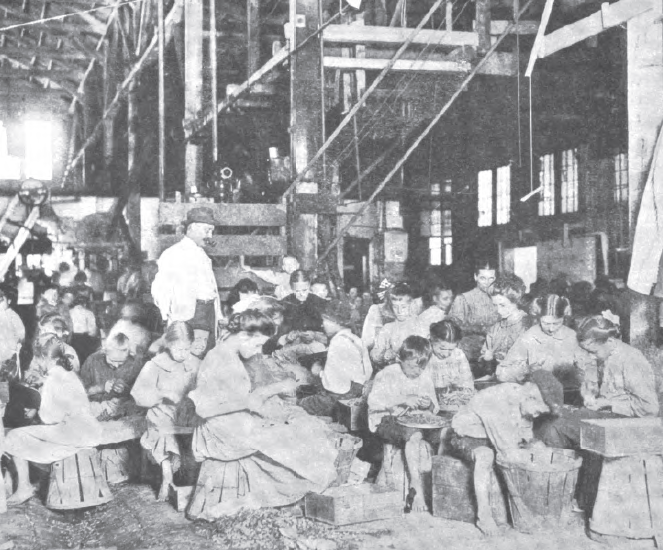
Photo 2.7: Children snipping beans in Maryland. (The Child Labor Bulletin, vol. 1, no. 4, February 1913, p. 39)
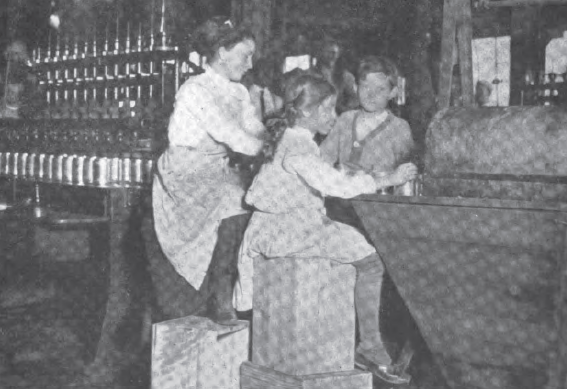
Photo 2.8: At a Dangerous Capping Machine. (The Child Labor Bulletin, vol. 1, no. 4, February 1913, p. 41)
Photo 2.9: A child employed as a doffer. (Annual Report of the Massachusetts Child Labor Committee, January 1, 1914)
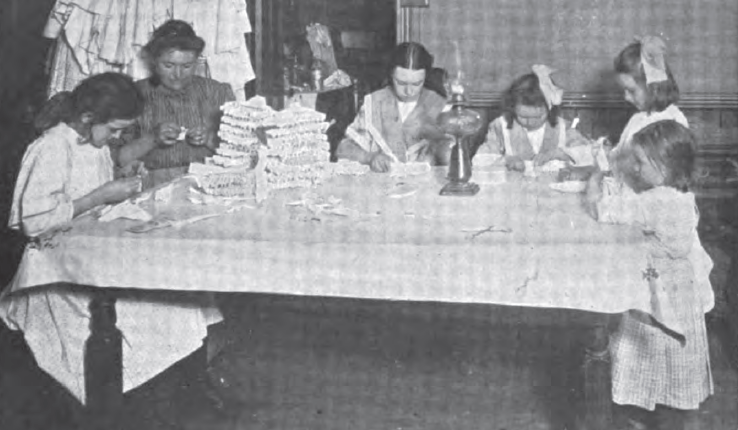
Photo 2.10: Children 6, 8, and two of 12 years making hose supporters by lamplight. (Annual Report of the Massachusetts Child Labor Committee, January 1, 1913, p. 41)
Photo 2.11: Massachusetts Mill Workers. (Annual Report of the Massachusetts Child Labor Committee, January 1, 1914)
Photo 2.12: Child factory workers. (Good Housekeeping, October 1913, p. 507)
Photo 2.13: Only a box for a house, and railroad yard for a playground. (The National Humane Review, vol. VII, no. 4, April 1919, p. 73)
Photo 4.2: Multiple site vaccination of 1898, showing a ‘typically good arm.’ (Derrick Baxby, “Smallpox Vaccination Techniques; from Knives and Forks to Needles and Pins,” Vaccine, vol. 20, no. 16, May 15, 2002, p. 2142) *First Edition: Photo 4.1
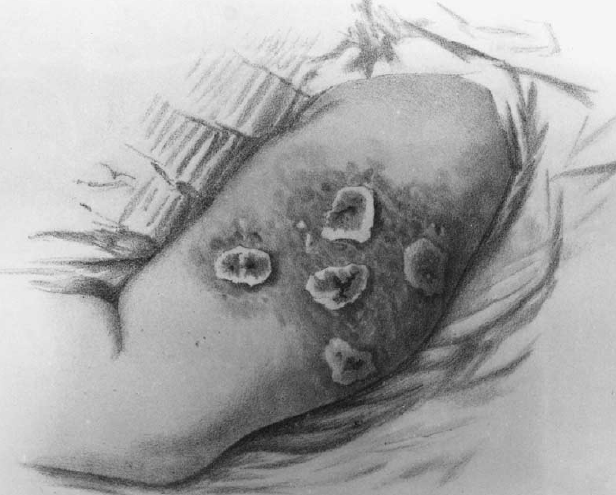
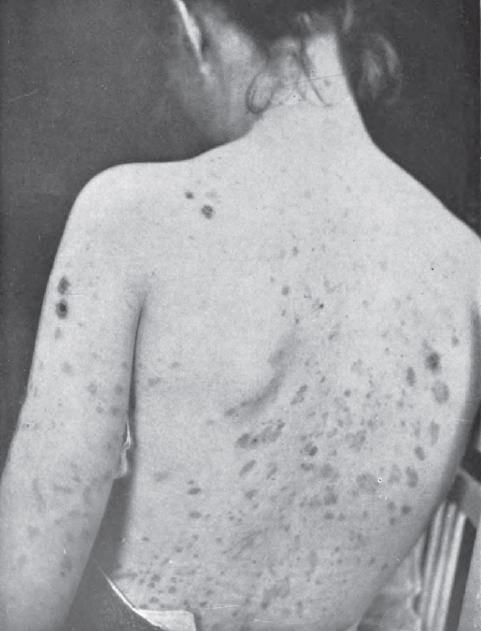
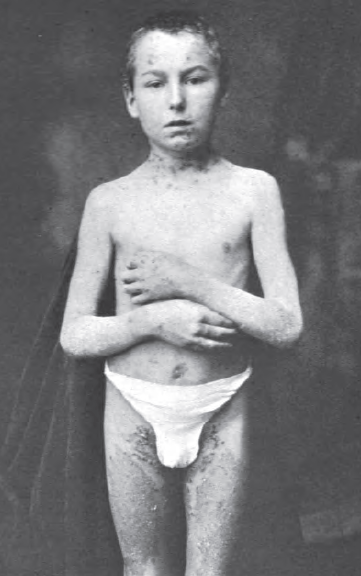
Photo 4.5: Mrs. L. H. age 27 lesions appeared 2 weeks after vaccination. (Journal of Cutaneous Disease, vol. XXII, 1904, p. 504) *First Edition: Photo 4.2
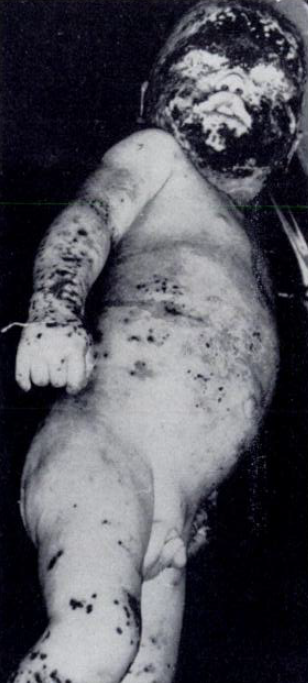
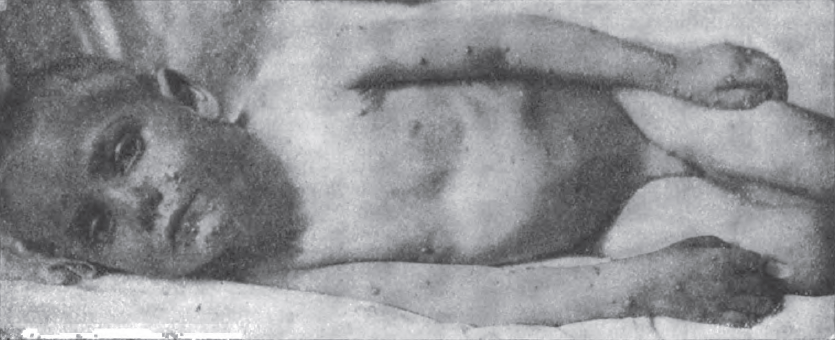
Photo 4.6: Post-mortem photograph of child described in Case 1. Areas of gangrene are secondarily infected with Pseudomonas aeroginosa, Micrococcus pyogenes and beta enterococcus. (Pediatrics, August 1958, p. 261) *First Edition: Photo 4.3
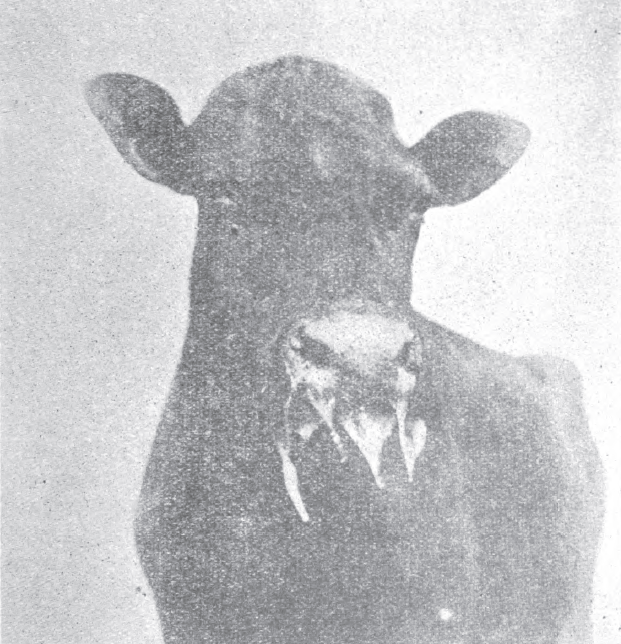
Photo 7.1: Head of cow affected with foot-and-mouth disease. (Bulletin No. 17, Department of Agriculture, 1914, p. 27) *First Edition: Photo 5.1
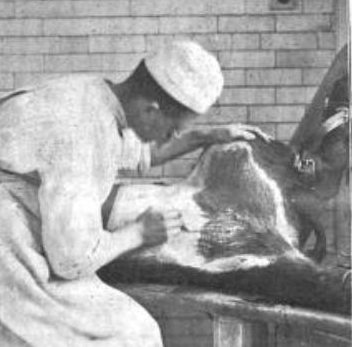
Photo 7.2: From the stable the calf is led to the operating room and strapped on the operating table. The shaved abdomen and thighs are again washed and then scarified with superficial linear incisions made with a surgeon’s knife. Into the bleeding incisions made by the knife, vaccine (cowpox) virus is carefully smeared with an ivory or metal instrument. (“Vaccine Virus—Its Preparation and Its Use,” Scientific American, January 19, 1901, p. 41) *First Edition: Photo 5.2
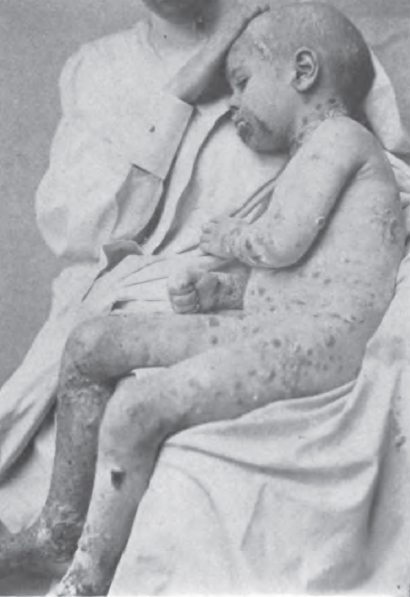
Photo 7.3: Bullous dermatitis closely allied to acute pemphigus (Diseases of the Skin and the Eruptive Fevers, 1908, p. 89) *First Edition: Photo 5.3
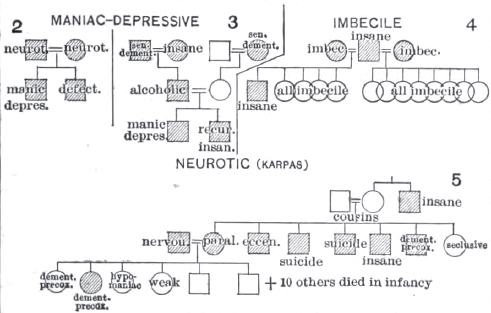
Photo 11.1: Portion of a Eugenics Chart. (Eugenics, The Science of Human Improvement by Better Breeding, 1910, p. 19) *First Edition: Photo 8.1
Photo 11.2: Feeble-Minded at Vineland Colony in New Jersey. “They have the bodies of adults but the minds of children. It is not to the interest of the state that they should be allowed to mingle with the normal population; and it is quite as little to their own interest, for they are not capable of competing with people who are normal mentally.” (Paul Popenoe, Applied Eugenics, the Macmillan Company, New York, 1918, p. 193)
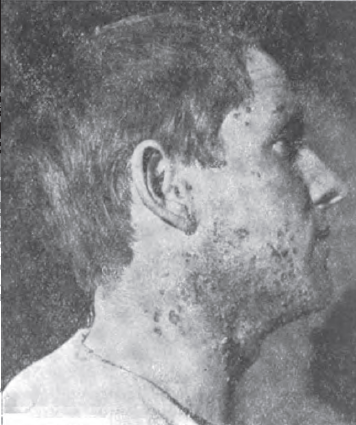
Photo 12.1: Arthur Smith, Jr. August 1915. (approximately 1 year after vaccination) *First Edition: Photo 9.1
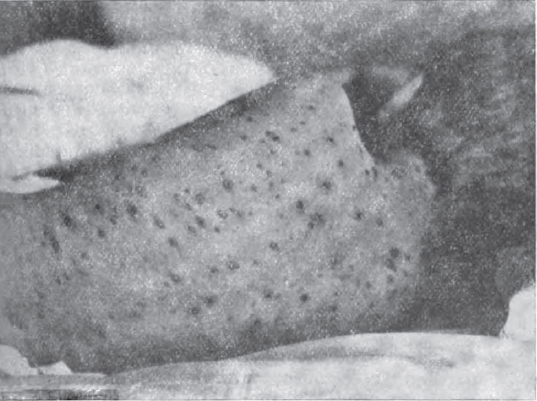
Photo 14.1: Extremely mild case of smallpox, bearing some resemblance to chickenpox. (American Medicine, vol. II, no. 23, December 7, 1901, p. 901) *First Edition: Photo 11.1
Photo 14.2: Impetigo contagion in an adult. (American Medicine, vol. II, no. 23, December 7, 1901, p. 901) *First Edition: Photo 11.2
Photo 14.3: Well marked eruption of chickenpox, showing lesions in varying stages of development. (American Medicine, vol. II, no. 23, December 7, 1901, p. 901) *First Edition: Photo 11.3
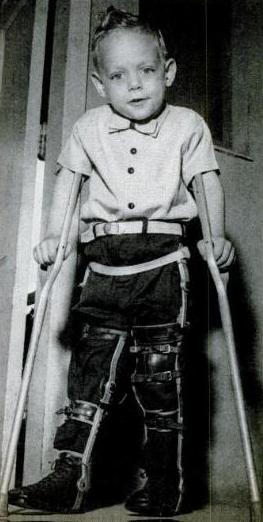
Photo 15.1: George Clark walks on crutches and heavy braces. He had polio attack last April. (Life, March 5, 1956, p. 63) *First Edition: Photo 12.1
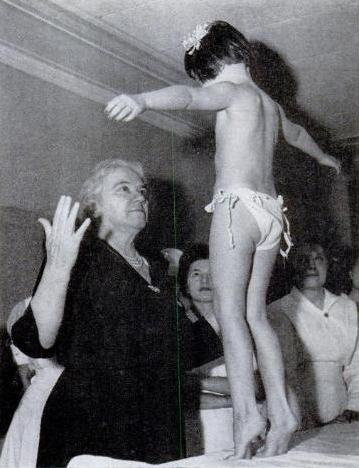
Photo 15.3: Sister Kenny encourages a polio patient to stand for the first time. (Life, September 16, 1946, p. 82) *First Edition: Photo 12.2
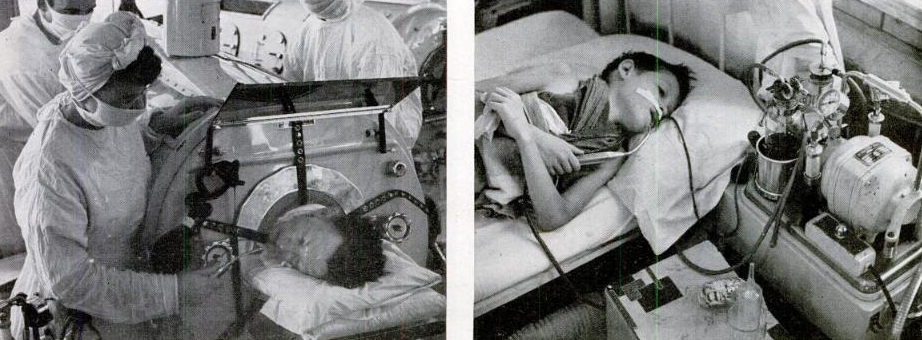
Photo 15.4: Iron lung encases 27-year-old Boyce Rash whose respiratory muscles have been paralyzed. Breathing function is so impaired that a mechanical apparatus is required to force air in and out of the patient’s lungs. Seven iron lungs were shipped to Hickory, two of them from Boston. John Bryan, 8, uses oxygen inhalator. It feeds oxygen to nose of patient who has difficulty in breathing normally. Most severe cases involve paralysis of respiratory muscles. Tube extending from mouth collect saliva which boy cannot swallow because of paralyzed throat muscles. (Life, July 31, 1944, p. 27) *First Edition: Photo 12.3
Photo 15.5: Knox Out DDT product advertisement. (Life, May 31, 1948, p. 102) *First Edition: Photo 12.4
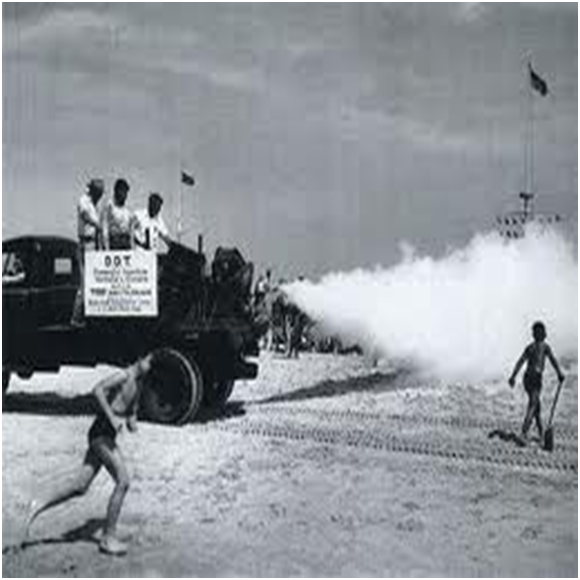
Photo 15.6: Flying and Biting Bugs on Jones Beach Die in a Cloud of DDT, New Insecticide—A truck-mounted for generator squirts the poison, mixed with oil droplets, over a four-mile area of the New York City playground. Spread by Army and Navy planes and by hand sprays, DDT routed dangerous disease-bearing flies and mosquitoes on Pacific islands. DDT has a drawback—it kills many beneficial and harmless insects, but does not kill all insect pests. Birds and fish which eat large numbers of DDT-poisoned insects may be casualties too. (National Geographic Magazine, October 1945, p. 410) *First Edition: Photo 12.5
Photo 15.7: “The great expectations held for DDT have been realized.” Penn Salt chemicals advertisement. (Time Magazine, June 30, 1947) *First Edition: Photo 12.6
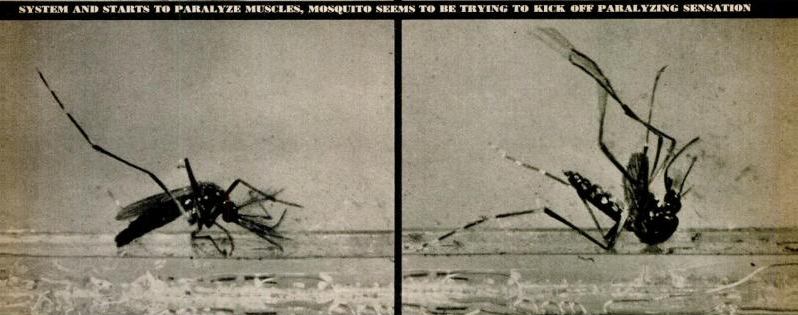
Photo 15.8: Speaking of Pictures… These Demonstrate How DDT Paralyzes a Mosquito—In glass case mosquito feels effects of DDT, gives frantic kick, leaps into air. As DDT enters nervous system and starts to paralyze muscles, mosquito seems to be trying to kick of paralyzing sensation. Paralysis of the nervous system affects the mosquito legs. The mosquito staggers, falls over, tries to push back onto its legs. It makes one last violent effort to rise but topples back onto its head. On its back and almost completely paralyzed, the mosquito continues to battle against DDT but only succeeds in wiggling convulsively. It took DDT 45 minutes to knock the mosquito out completely. (Life, January 21, 1946, p. 11) *First Edition: Photo 12.7
Photo 18.1: Infantile Scurvy. Ellen S. Five years old. The gums are swollen or beefy and hanging in tumor-like masses. There are also blood-tumors on the forehead. (Louis Fischer, MD, Diseases of Infancy and Childhood: Their Dietetic, Hygienic, and Medical Treatment, F. A. Davis Company, 1914, p. 257) *First Edition: Photo 15.1
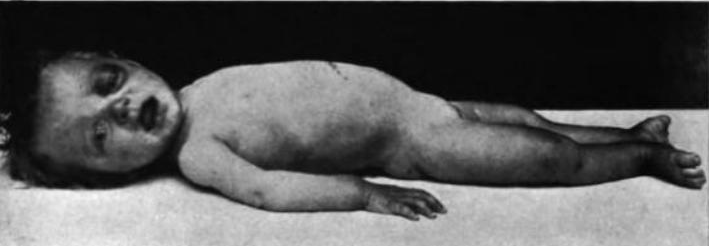
Photo 18.2: Characteristic position of the legs in scurvy. The legs are practically always tender, usually exquisitely so, so that the slightest movement or pressure causes the most severe pain. (Lewis Webb Hill, MD, Practical Infant Feeding, W. B. Saunders Company, 1922, p. 426) *First Edition: Photo 15.2